


A stacked imbalance is three or more neighbouring prices in one footprint bar where aggressive buyers traded at least three times the selling one price lower, or sellers three times the buying one price higher. It marks a band one side took by force. Klustra draws it on the footprint, and as a zone on any chart.
What is a stacked imbalance?
Every trade on an exchange has an aggressor: someone who bought at the offer or sold at the bid rather than wait. A footprint chart splits each bar into its prices and prints how much was sold into the bid and bought at the offer at each one. An imbalance is a price where one side of that comparison overwhelmed the other. A stacked imbalance is several of them in a row, on the same side, in the same bar: buyers lifting the offer price after price while sellers barely appeared, or the reverse.
Traders call them stacked imbalances, imbalance stacks, stacked bid or ask imbalances, or simply stacks. One imbalance is common and usually noise. A stack is a stretch of price where one side kept paying up and the other kept refusing to meet it, which is why traders mark the band and watch what price does when it comes back.
What is a bid-ask imbalance?
An imbalance is read diagonally, not straight across a row. A buyer lifting the offer at a price is trading against sellers resting at that price, one step above the best bid; the selling that competes with that buyer is the selling into the bid one price lower. So Klustra compares:
- Buy imbalance: the market buying at a price against the market selling one price step lower. Marked when the buying is at least 3× the selling.
- Sell imbalance: the market selling at a price against the market buying one price step higher. Marked when the selling is at least 3× the buying.
Comparing a row with itself would set trades against each other that were never competing for the same resting orders. The table below is the bottom of a real bar, the five-minute Bitcoin perpetual bar of 03:00 UTC on 7 October 2026, in $10 rows. Read each buying figure against the selling figure one row down.
| Price | Sold (bid) | Bought (ask) | Buying ÷ selling one row lower | Buy imbalance? |
|---|---|---|---|---|
| 83,870 | 14.1 | 26.8 | 26.8 ÷ 18.8 = 1.4× | No |
| 83,860 | 18.8 | 62.0 | 62.0 ÷ 13.4 = 4.6× | Yes |
| 83,850 | 13.4 | 22.9 | 22.9 ÷ 4.66 = 4.9× | Yes |
| 83,840 | 4.66 | 8.09 | 8.09 ÷ 0.002 = 4,045× | Yes |
| 83,830 | 0.002 | 7.08 | 7.08 ÷ 0.019 = 373× | Yes |
| 83,820 | 0.019 | 2.60 | 2.60 ÷ 3.01 = 0.9× | No |
What makes a stack
Three or more imbalances on the same side at consecutive prices: by default, three. Consecutive means neighbouring prices, not neighbouring rows. A footprint only prints the prices that traded, so two rows printed one above the other can be several prices apart, and an imbalance either side of a price that never traded is two separate signals, not one stack. Klustra checks the prices, not the rows.
How Klustra finds stacked imbalances
Your browser opens the exchange’s public trade stream directly, and a Web Worker sorts every trade into its bar and its price row, by the side the exchange says was the aggressor. The imbalances and stacks are worked out from those rows as the chart draws them, so a stack appears the moment the trades that make it print. On Binance the aggressor is the `m` flag of each aggregate trade: buyer is maker means the seller crossed the spread.
Rows follow the zoom
A row is not always one exchange tick. Klustra groups ticks into rows so that each cell stays readable, and the grouping follows the zoom: on the Bitcoin perpetual on 7 October 2026 a one-minute chart at its default zoom used $2 to $5 rows, a five-minute chart $10. Imbalances and stacks are measured on the rows you see, the way every footprint platform measures them on its ticks-per-row setting. Zoom out and rows get taller, so the same trades can stack differently. The rows always sit on the exchange’s own tick grid, so no price is ever invented.
Four rules worth knowing
- Against zero counts. Buying at a price where nothing sold one row lower is an imbalance at any ratio. Most footprint tools do the same unless told to ignore zeros.
- A price that never traded is a real zero. It can make the row above it an imbalance, and it breaks a stack.
- The edges have no partner. A bar’s lowest row is never a buy imbalance and its highest never a sell imbalance: nothing in the bar traded beyond them to compare with.
- The forming bar is live. Its stacks can grow or vanish until it closes; zones are only made from closed bars.
How accurate it is
We checked the tool before writing this page, on 7 October 2026, in two steps. First, a separate program rebuilt bars from Binance’s own trade record with exact whole-number arithmetic: every level of 52 closed bars, 829 price rows built from 130,635 trades, matched the chart exactly. Then it applied the rule above, again in exact arithmetic, to every bar the chart held and compared the result with what the chart had drawn, mark by mark: every rail (89) and every underline (737) was where the rule puts it, on the Bitcoin and Ether perpetuals, Bitcoin spot, the 1000PEPE perpetual, Bybit and Hyperliquid’s gold. The check found one real defect: volumes are held as binary fractions, so a ratio of exactly 3× could read as 2.9999999999999996× and go unmarked. It happened live once in about a thousand rows: 0.108 bought against 0.036 sold. It is fixed: an exact 3× now counts as 3×.
How to read stacked imbalances
Eight five-minute bars of the Bitcoin perpetual, with Imbalance stacks on. Open each mark on the picture.
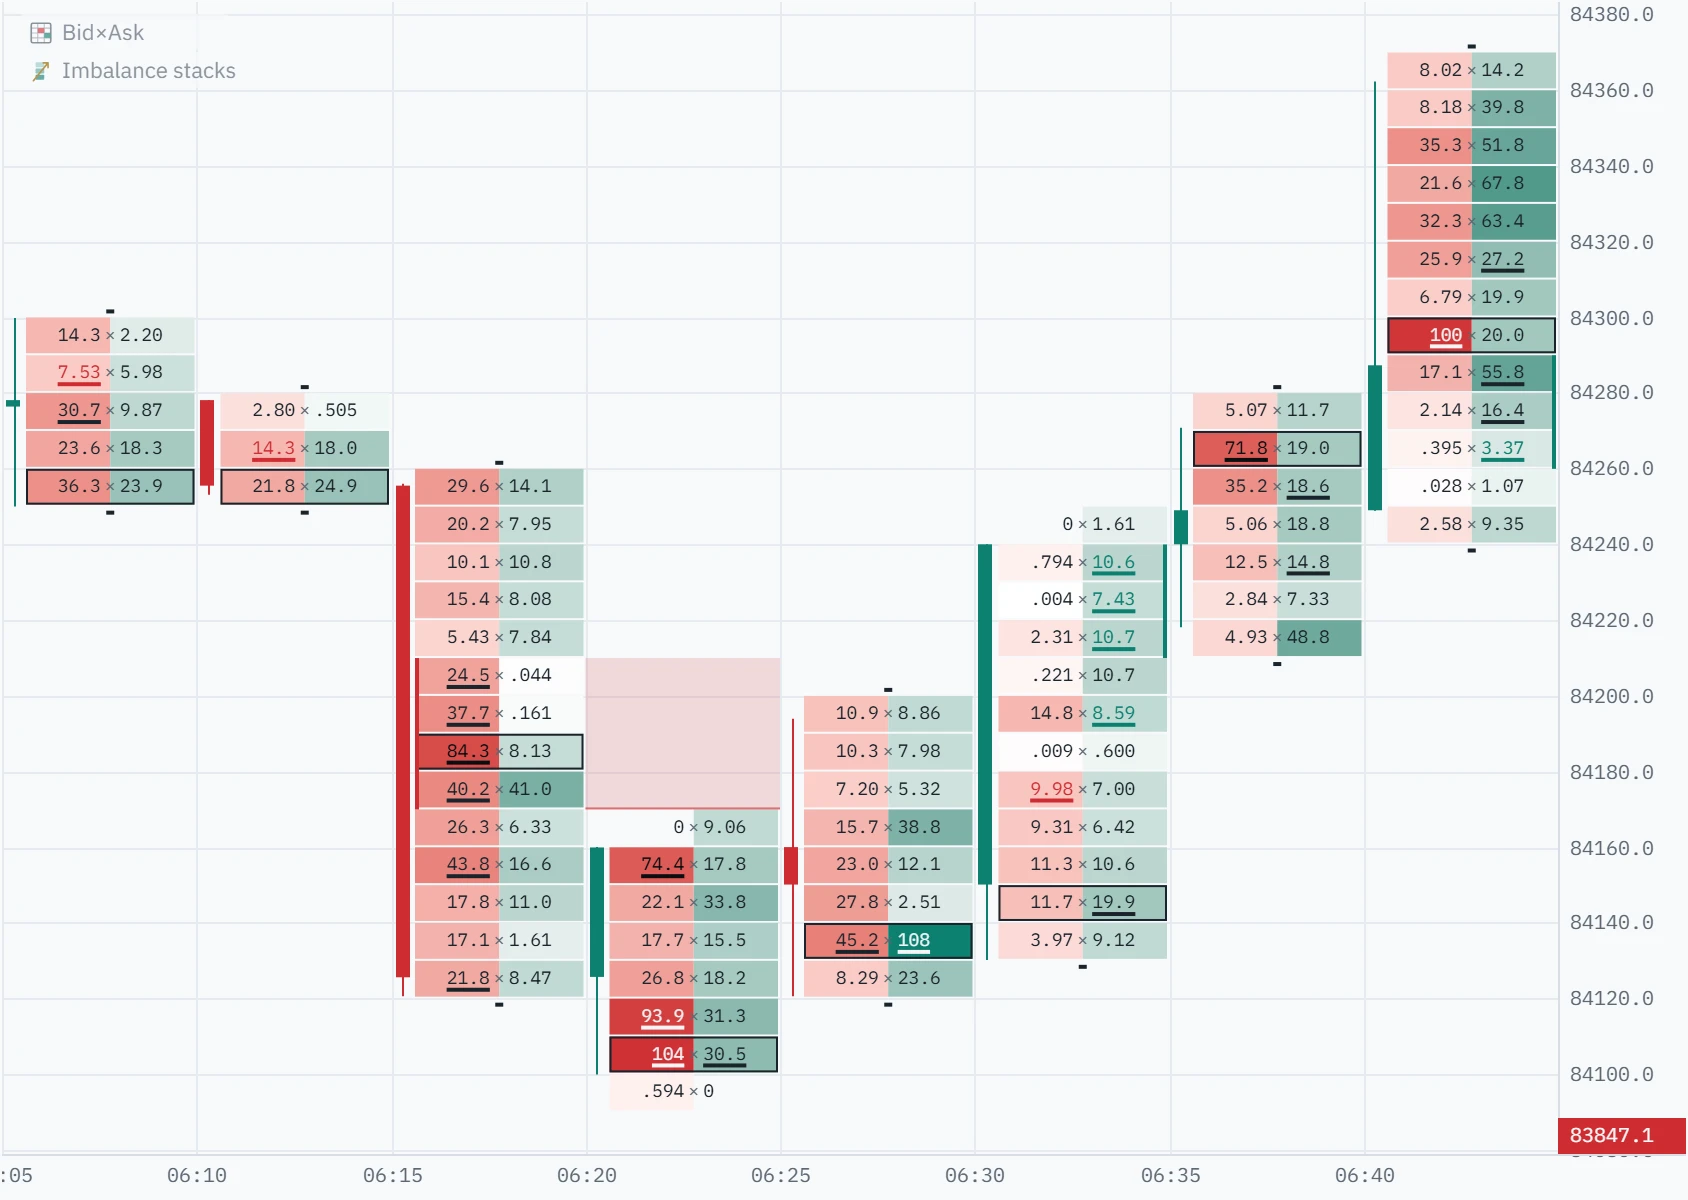
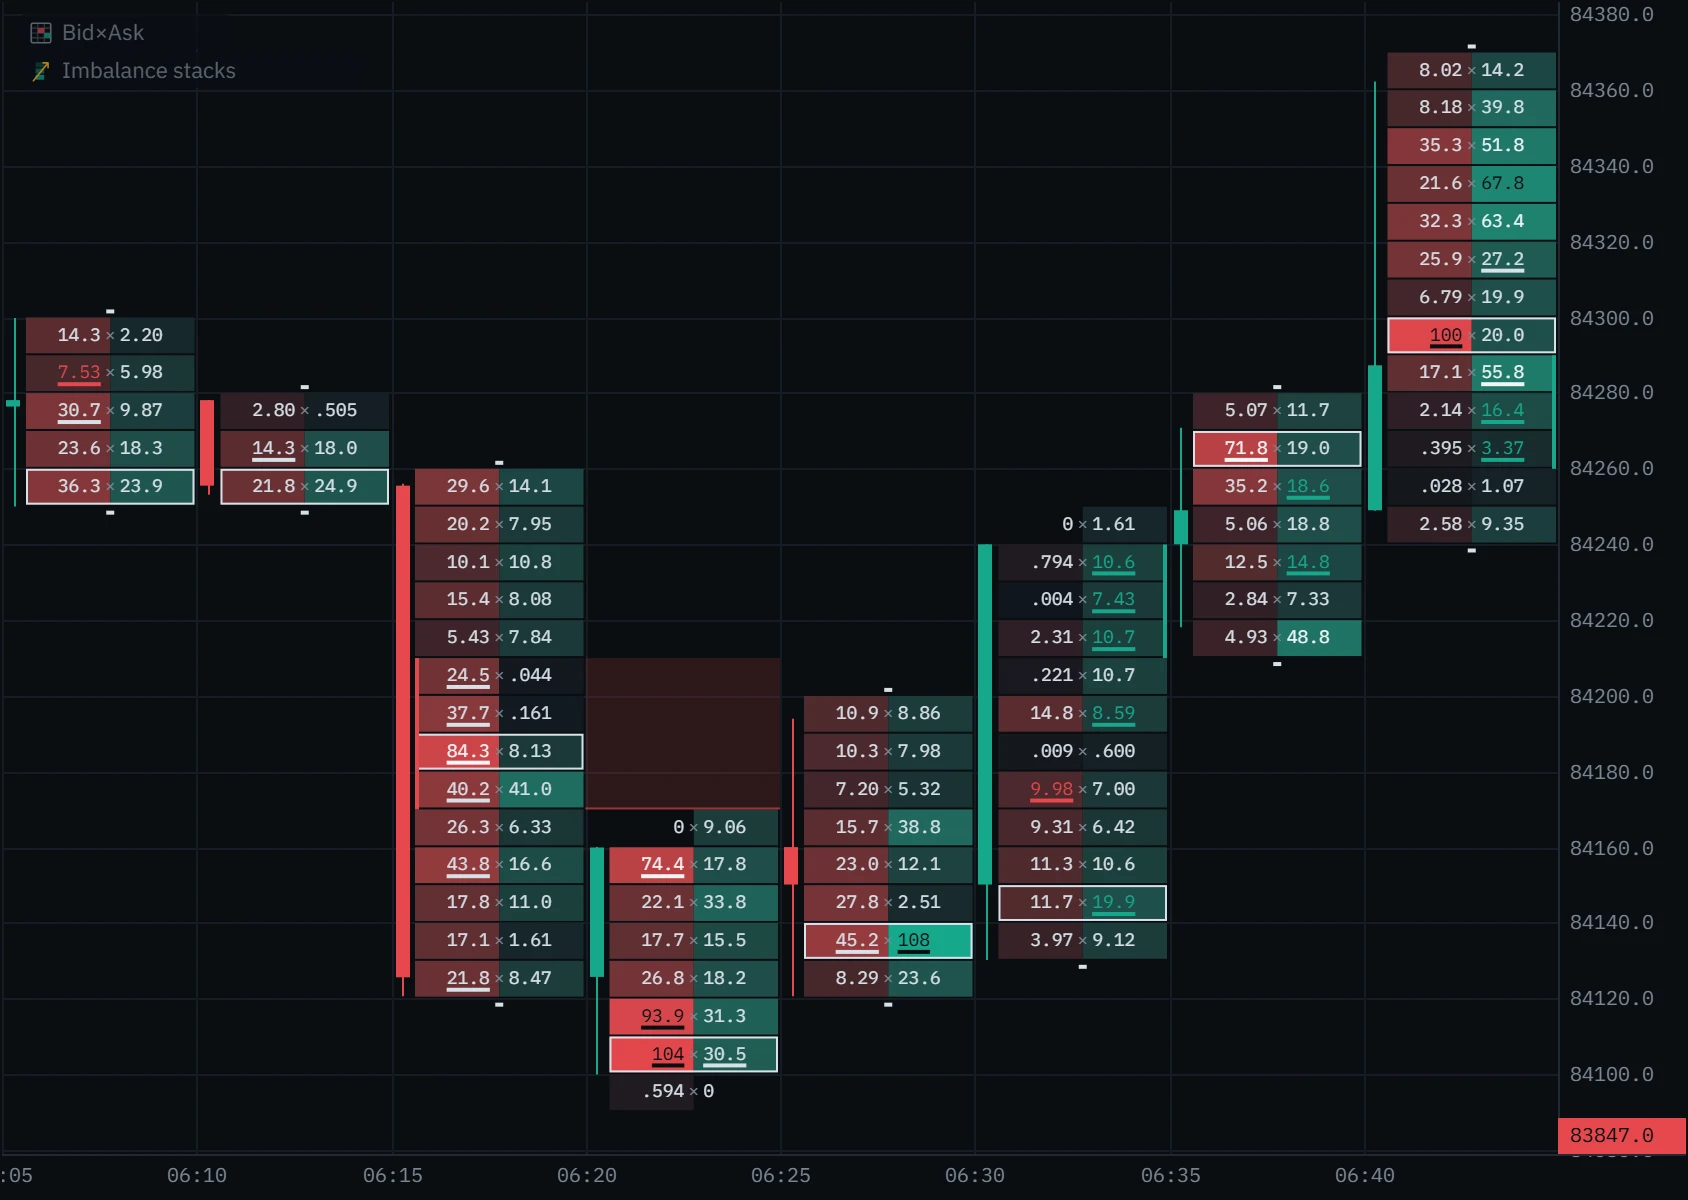
Imbalance stacks: stacked imbalances as zones
The Imbalance stacks indicator turns every stack into a band of price. A zone starts at the end of the bar that made the stack and runs right until the first later bar that trades back into it, then stops at that bar. A zone still open runs to the right edge of the chart. It draws on candles as well as on the footprint, so the order flow can stay on screen while the chart stays clean.
- Green zones are buy stacks, with the edge on top: support, if anything. Red zones are sell stacks, edged underneath.
- A stack traded back into by the very next bar draws nothing: it was revisited before it could start.
- Only closed bars make zones, so a zone never appears and then vanishes.
- A minute in which nothing traded never counts as price coming back.
- On a footprint, a zone starts exactly where the rail is drawn: both read the same two settings.
On a candle chart the zones use the rows the footprint would use at that zoom, so switching between candles and the footprint keeps the same zones. While they are on, a volume profile drawn over the candles uses those rows too.
What ratio and stack length should you use?
The defaults, 3× and three levels, are the common ones; most order-flow traders set the ratio between 2× and 4×. What changes the picture far more is the row size. We counted every stack on the Bitcoin perpetual over the whole of 6 October 2026, from Binance’s published trade file: 900,371 trades, re-derived with the chart’s exact rule.
| Bars and rows | Stacks per hour | Bars with a stack | Rows marked as imbalances |
|---|---|---|---|
| 1m, $2 rows | 82.7 | 69% | 75% |
| 1m, $5 rows | 27.5 | 37% | 58% |
| 1m, $10 rows | 11.4 | 18% | 47% |
| 5m, $10 rows | 4.1 | 28% | 41% |
| 5m, $20 rows | 1.4 | 11% | 36% |
| 15m, $50 rows | 0.2 | 5% | 31% |
At fine rows the ratio hardly matters: on one-minute bars in $2 rows, raising it from 3× to 5× only cut stacks from 82.7 to 73.2 an hour, because so many of them are against zero. A longer minimum does more (3× and four levels: 53.3 an hour), and taller rows do the most. On the Ether perpetual the same day, one-minute bars gave 18.1 stacks an hour in $0.20 rows and 4.1 in $0.50 rows; Solana, 36.7 in one-cent rows and 12.4 in two-cent rows.
- Scalping the Bitcoin or Ether perpetual on 1m: keep 3×, raise the minimum to 4 or 5, or zoom out a step so rows are $5 or more.
- Intraday on 5m to 15m: the defaults. Stacks are rare enough that each one is an event.
- Thin altcoins: raise the ratio to 4× or 5× and the minimum to 4. Thin rows are where zero-against-something imbalances pile up.
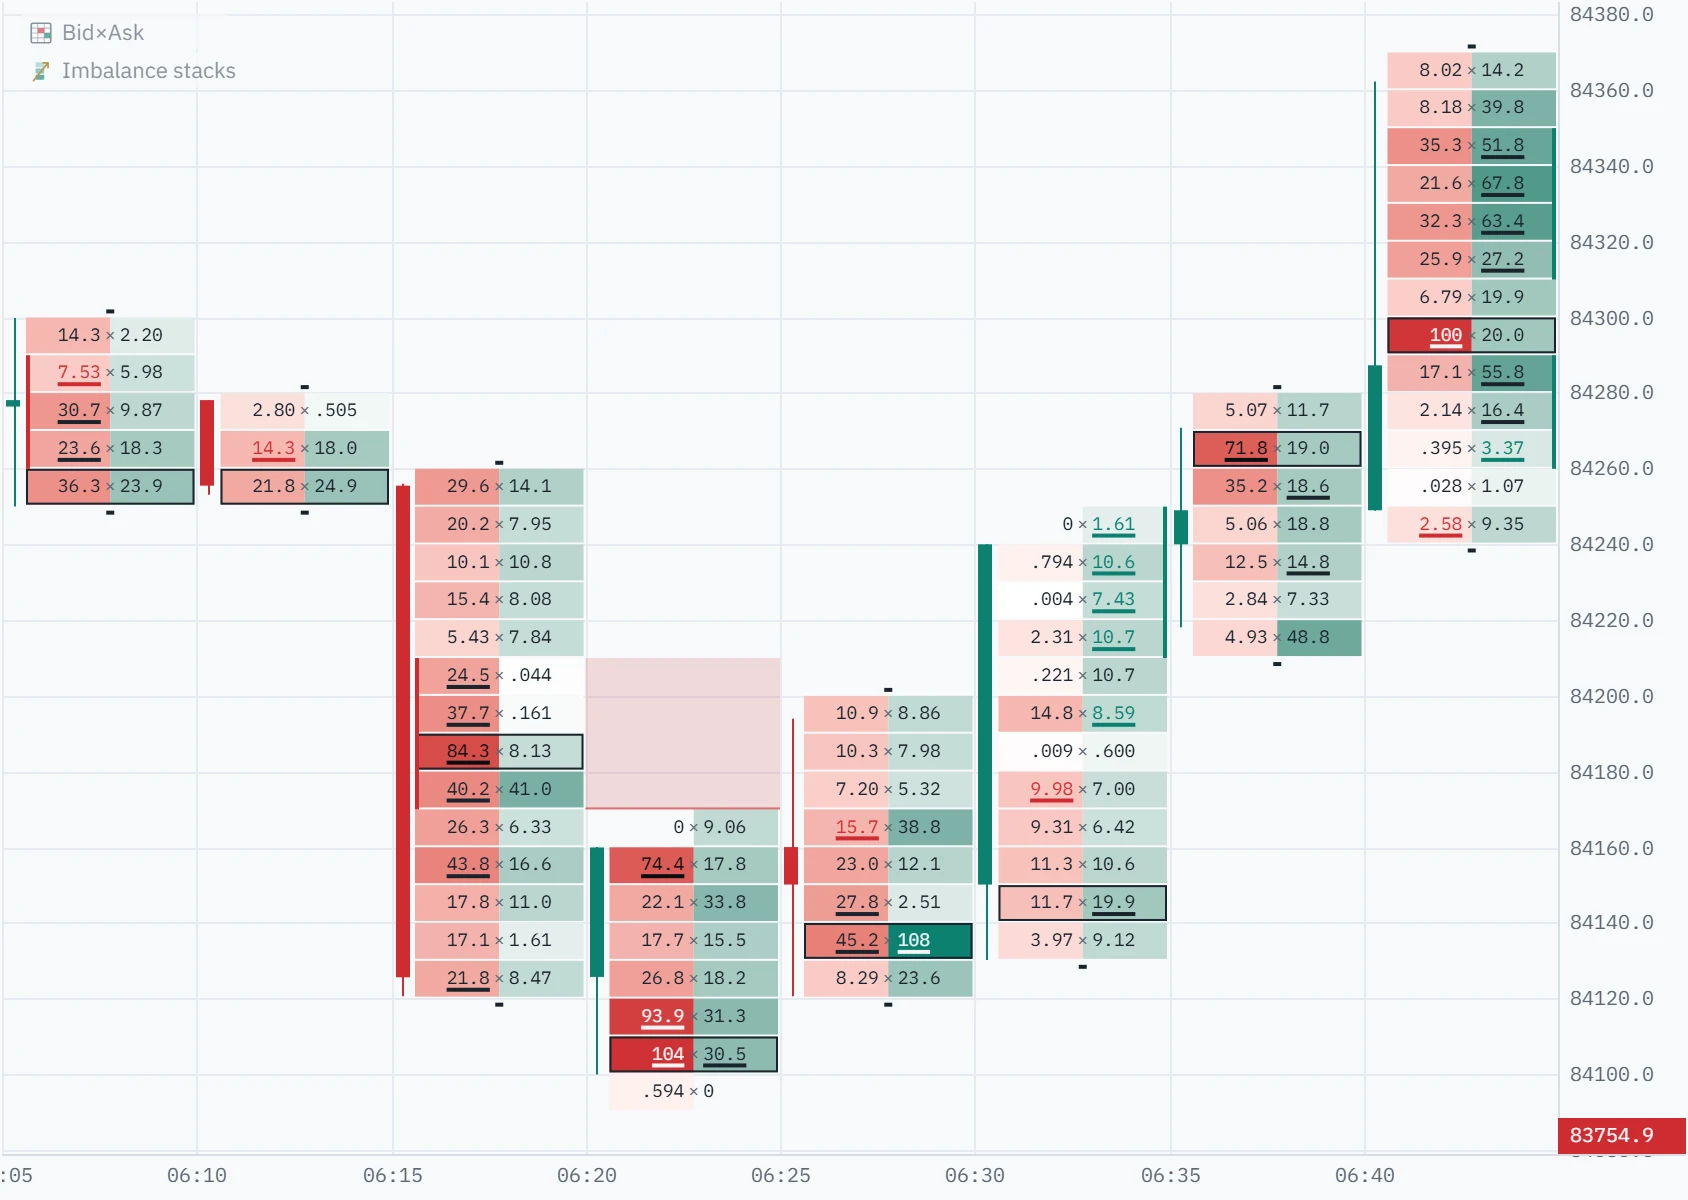
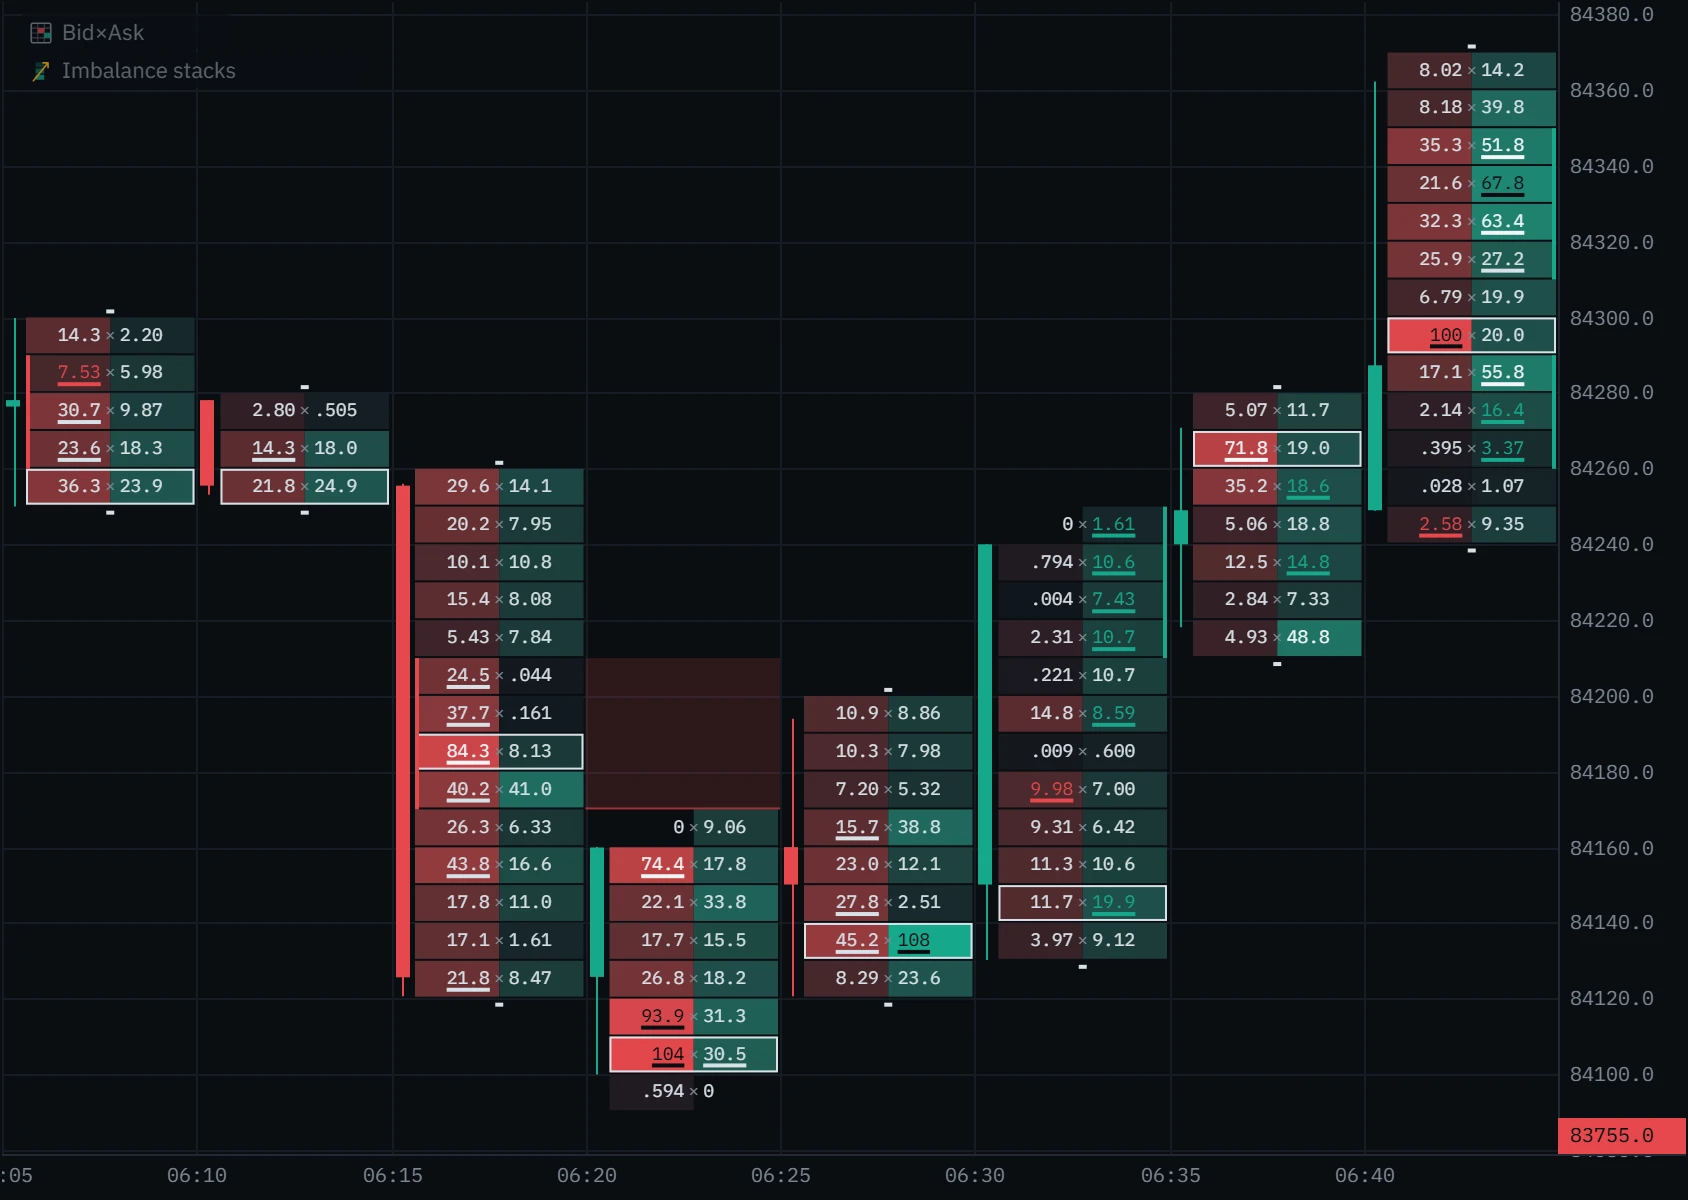
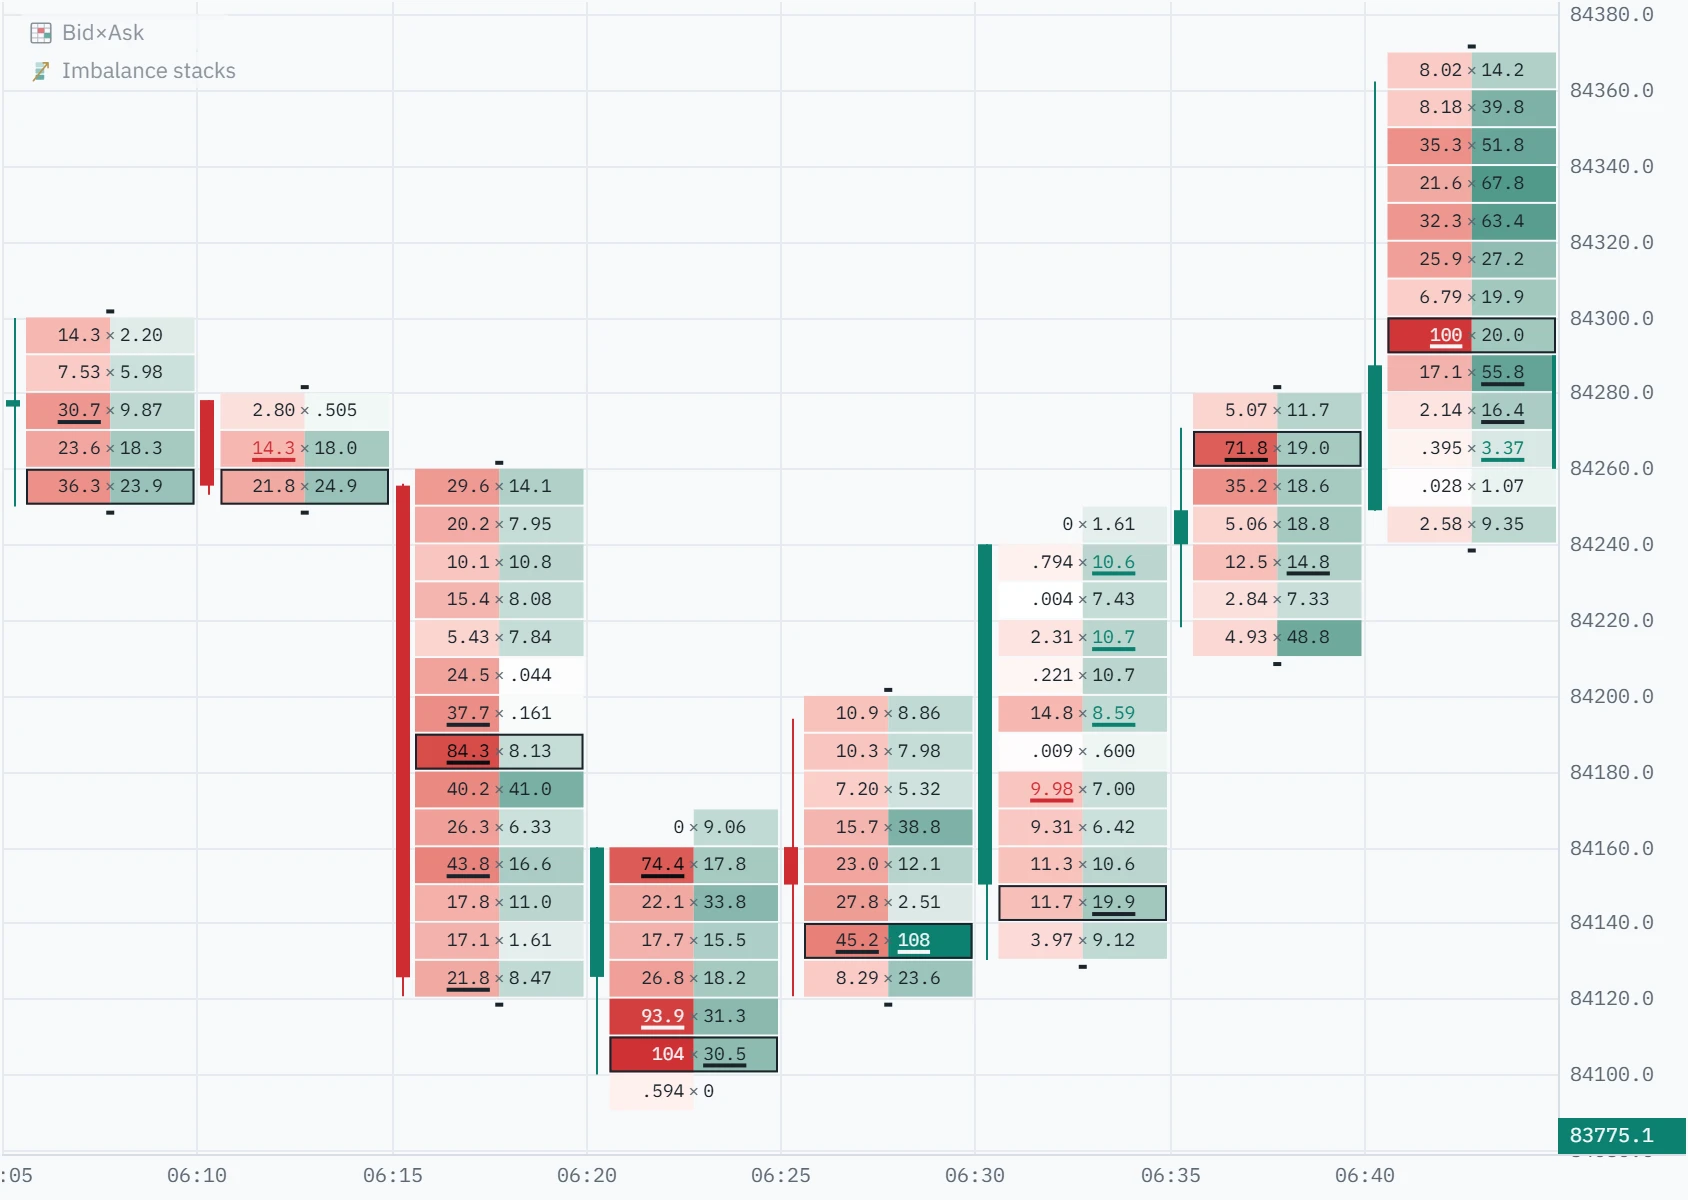
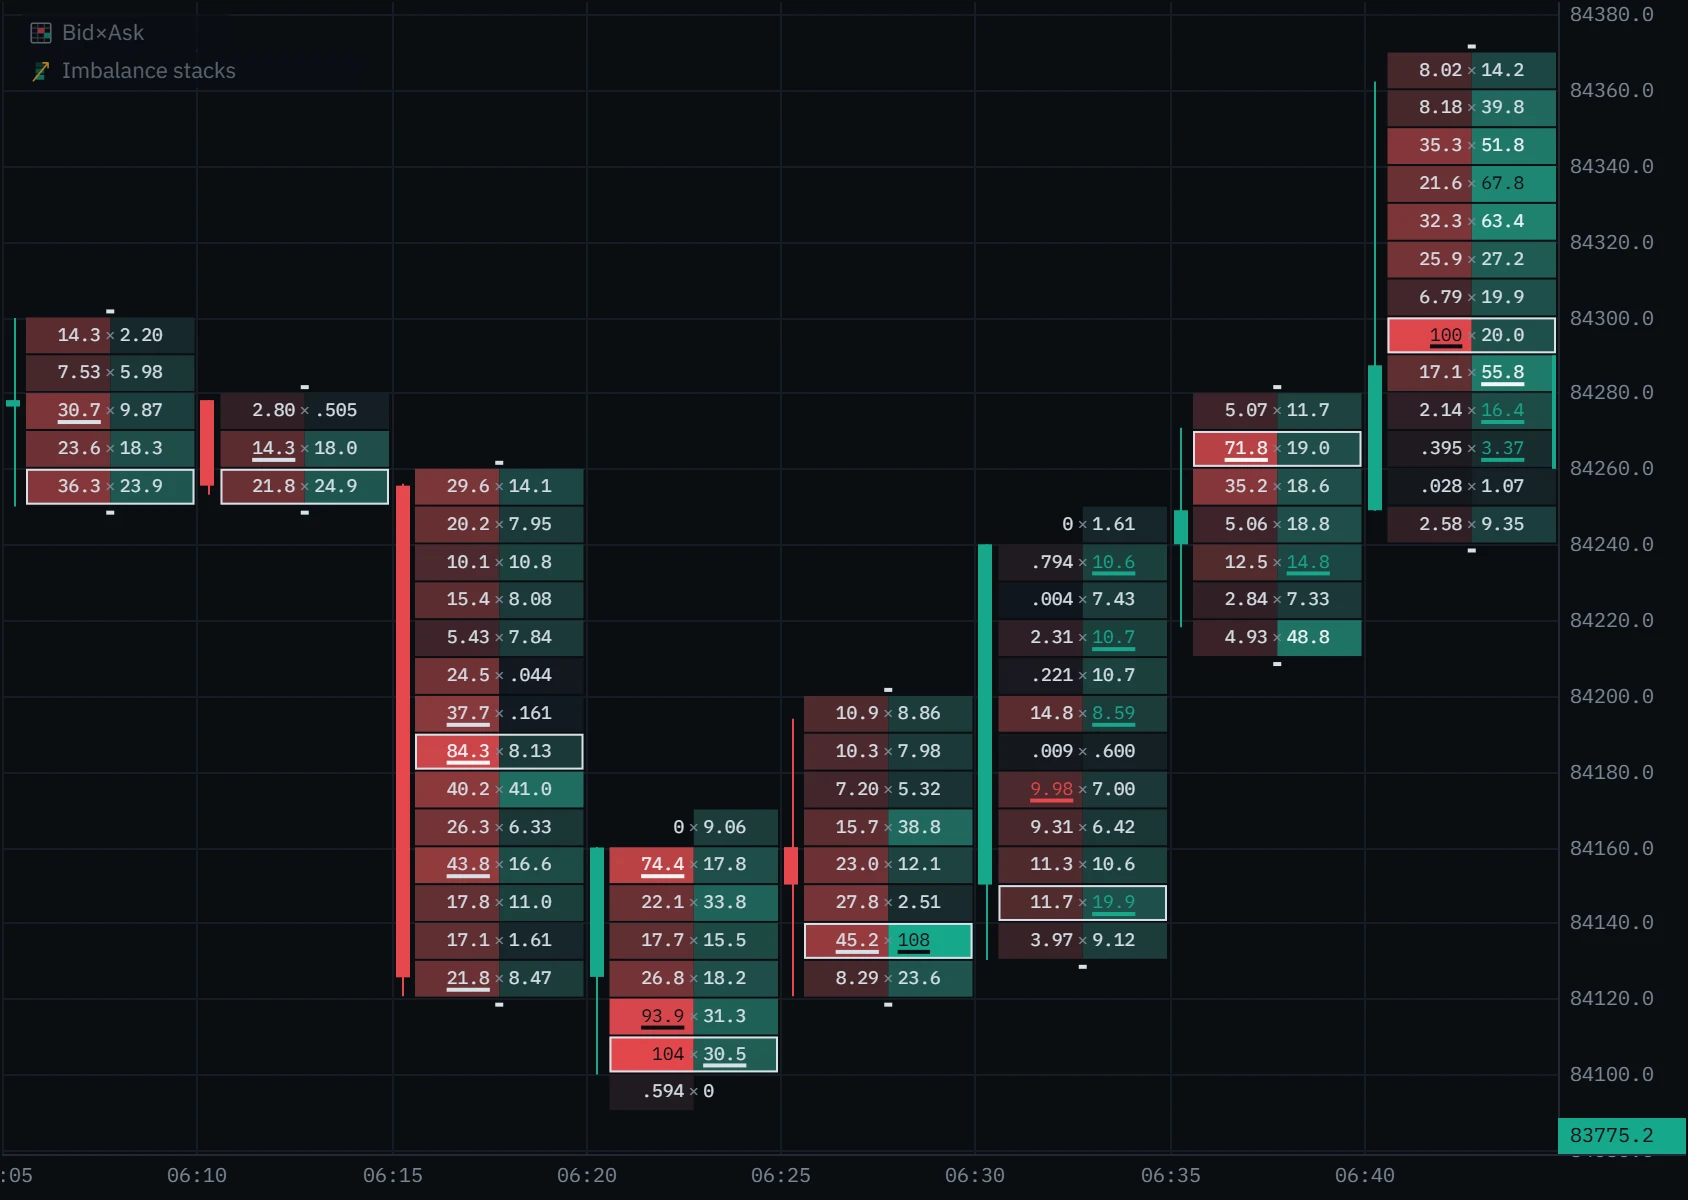
Stacked imbalance patterns to look for
A stack says one side was in a hurry across a band of prices. What it meant is decided by what price does next, and especially by what happens when price comes back.
A bar breaks a level and leaves a stack on the way through. The breakout was driven by aggression, not by an empty book. Continuation is more likely while price stays on the far side of the stack.
- Look for
- A stack through a level you marked
- Wrong if
- Price trades back through the stack
How to trade stacked imbalances
Mark the context first
Yesterday’s high and low, a range edge, a level price has turned at. A stack in the middle of nowhere rarely matters.
Let the zones do the remembering
Switch Imbalance stacks on. Each open zone is a band that one side took by force and price has not been back to.
Wait for the first return
The first visit is the test. Watch the bar that touches the zone on the footprint: do the builders show up again, or does the other side trade straight through?
Confirm with delta
A defended buy zone usually shows sellers absorbed inside it; the delta panel and CVD show whether the selling into the zone got anywhere.
Know where you are wrong
If you trade a defence, the idea is wrong once price trades beyond the zone’s far edge, plus a little room. Size from that distance, not from the target.
How often does a zone hold? On 6 October 2026, on the Bitcoin perpetual at 3× and three levels, most stacks were traded back into by the very next bar: 58% in $2 rows, 70% in $5 rows, 79% in $10 rows. Of the zones that lasted longer, 83% to 88% were revisited within the hour. On that first visit the touching bar stayed inside the zone 30% of the time in $2 rows (828 zones), 58% in $5 rows (200 zones) and 67% in $10 rows (58 zones). One day of one market is not a strategy test, and a zone that holds once can still give way on the next visit, as the example below shows. Taller rows made fewer, more meaningful zones.
A worked example: a zone that held, then broke
At 03:00 UTC on 7 October 2026 Bitcoin was at its low of the night, 83,817. In the next five minutes it rose to 84,050, and the footprint of that bar shows how: buyers lifted the offer through 83,830 to 83,860 while almost nothing sold below them.
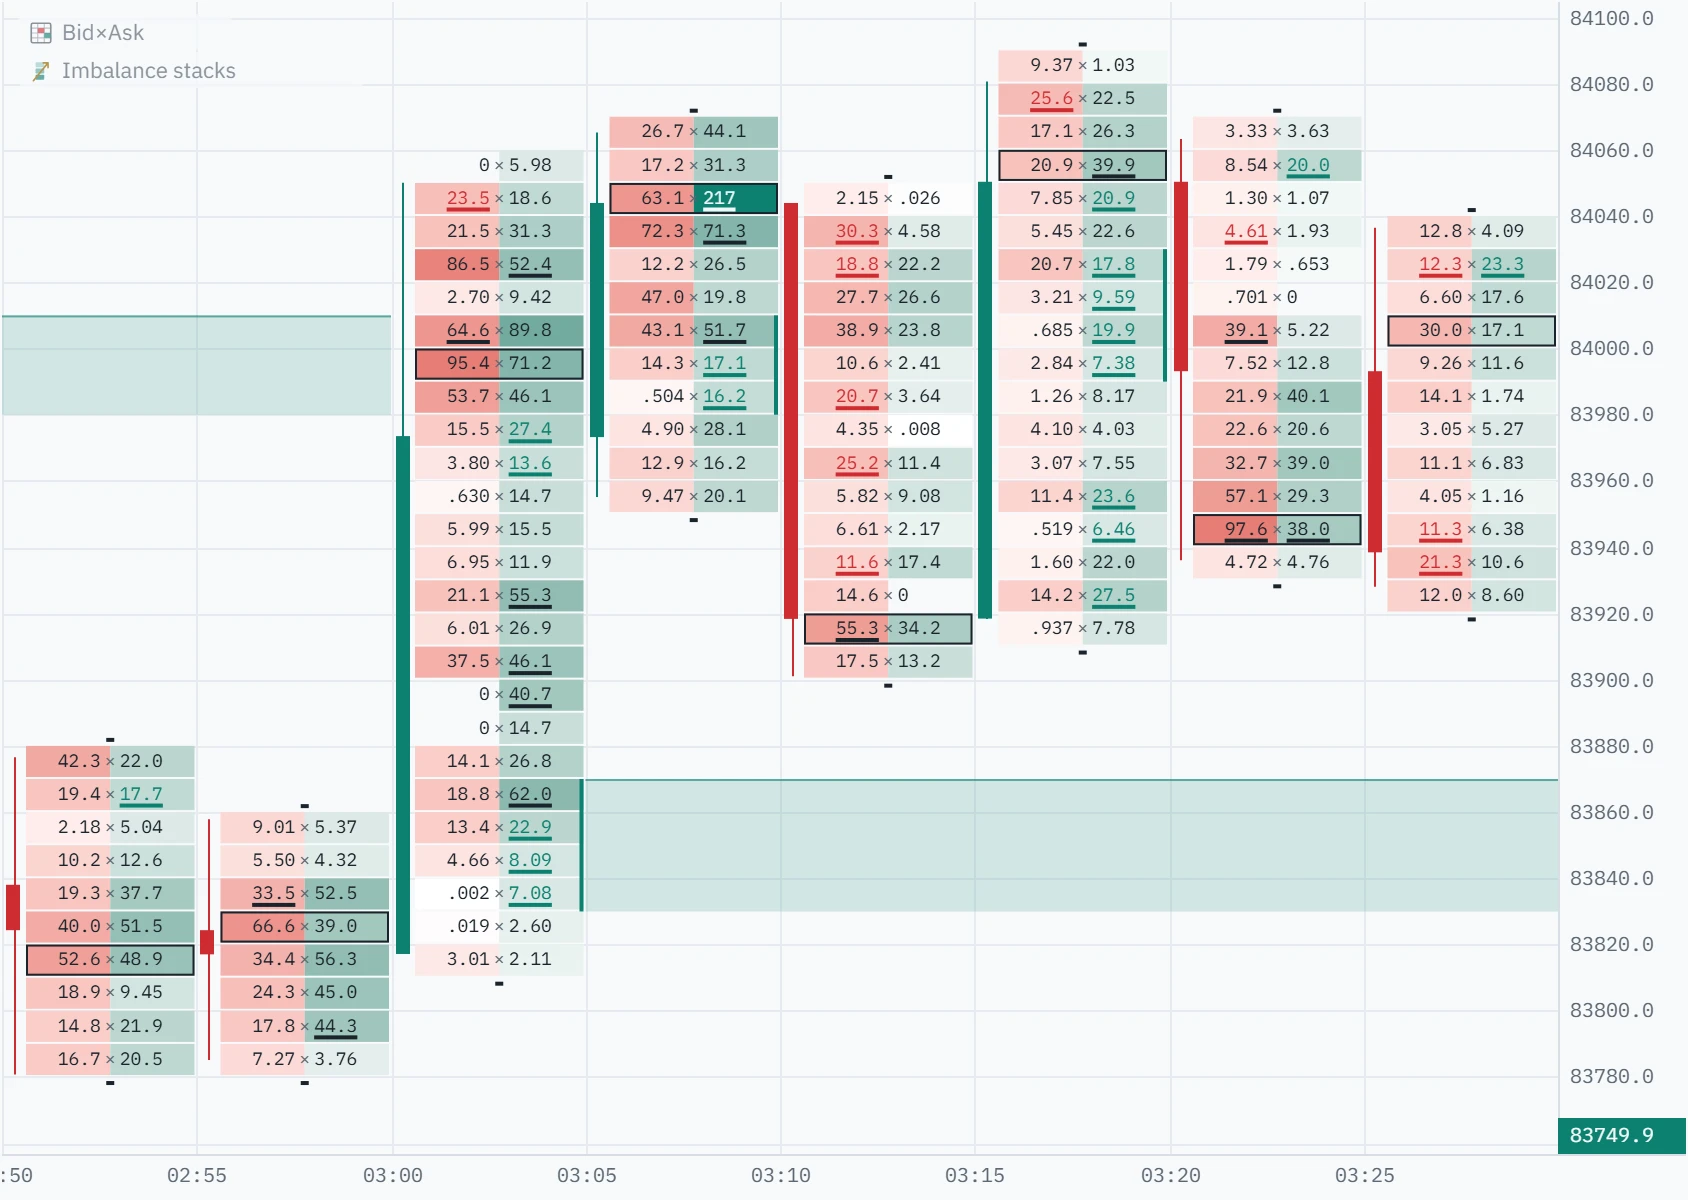
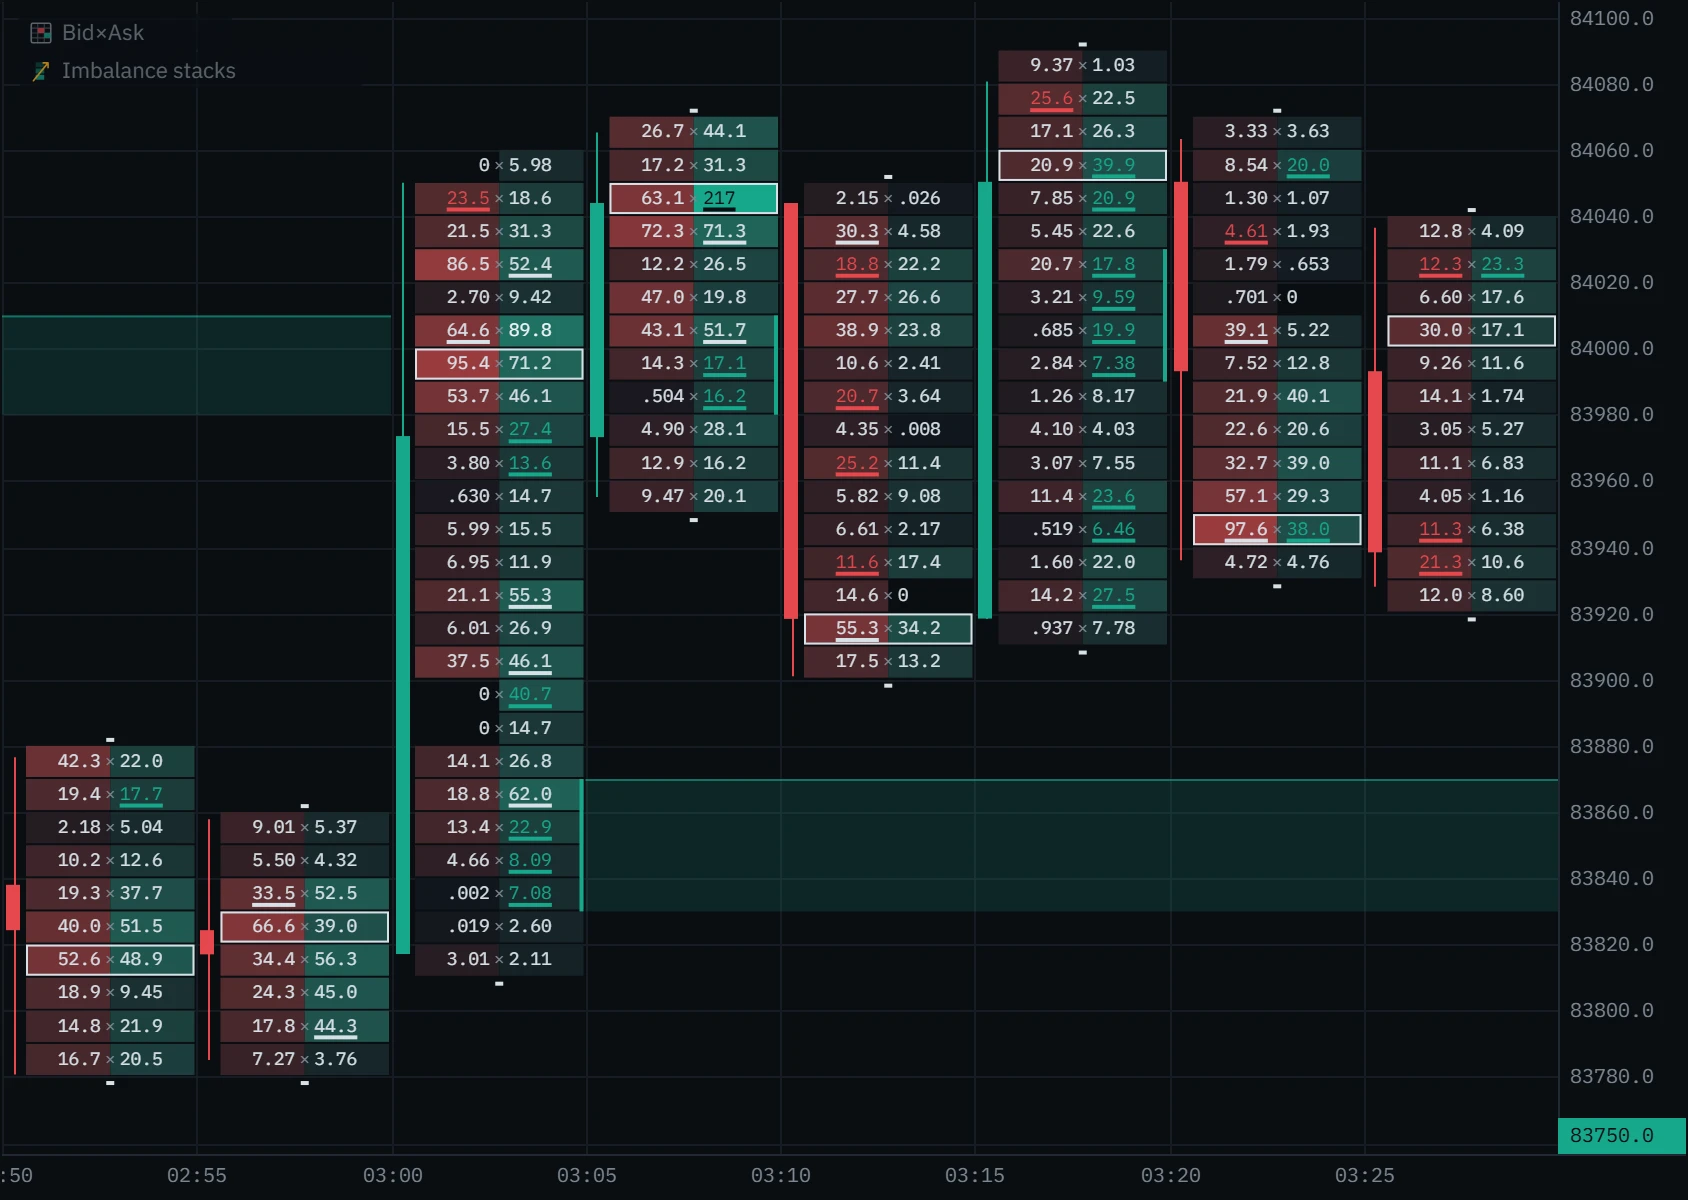
Zoomed out to six hours of five-minute candles, rows are $20 and the same stack covers 83,820 to 83,880. Its zone ran untouched for six hours while price rallied to 84,362 and came back.
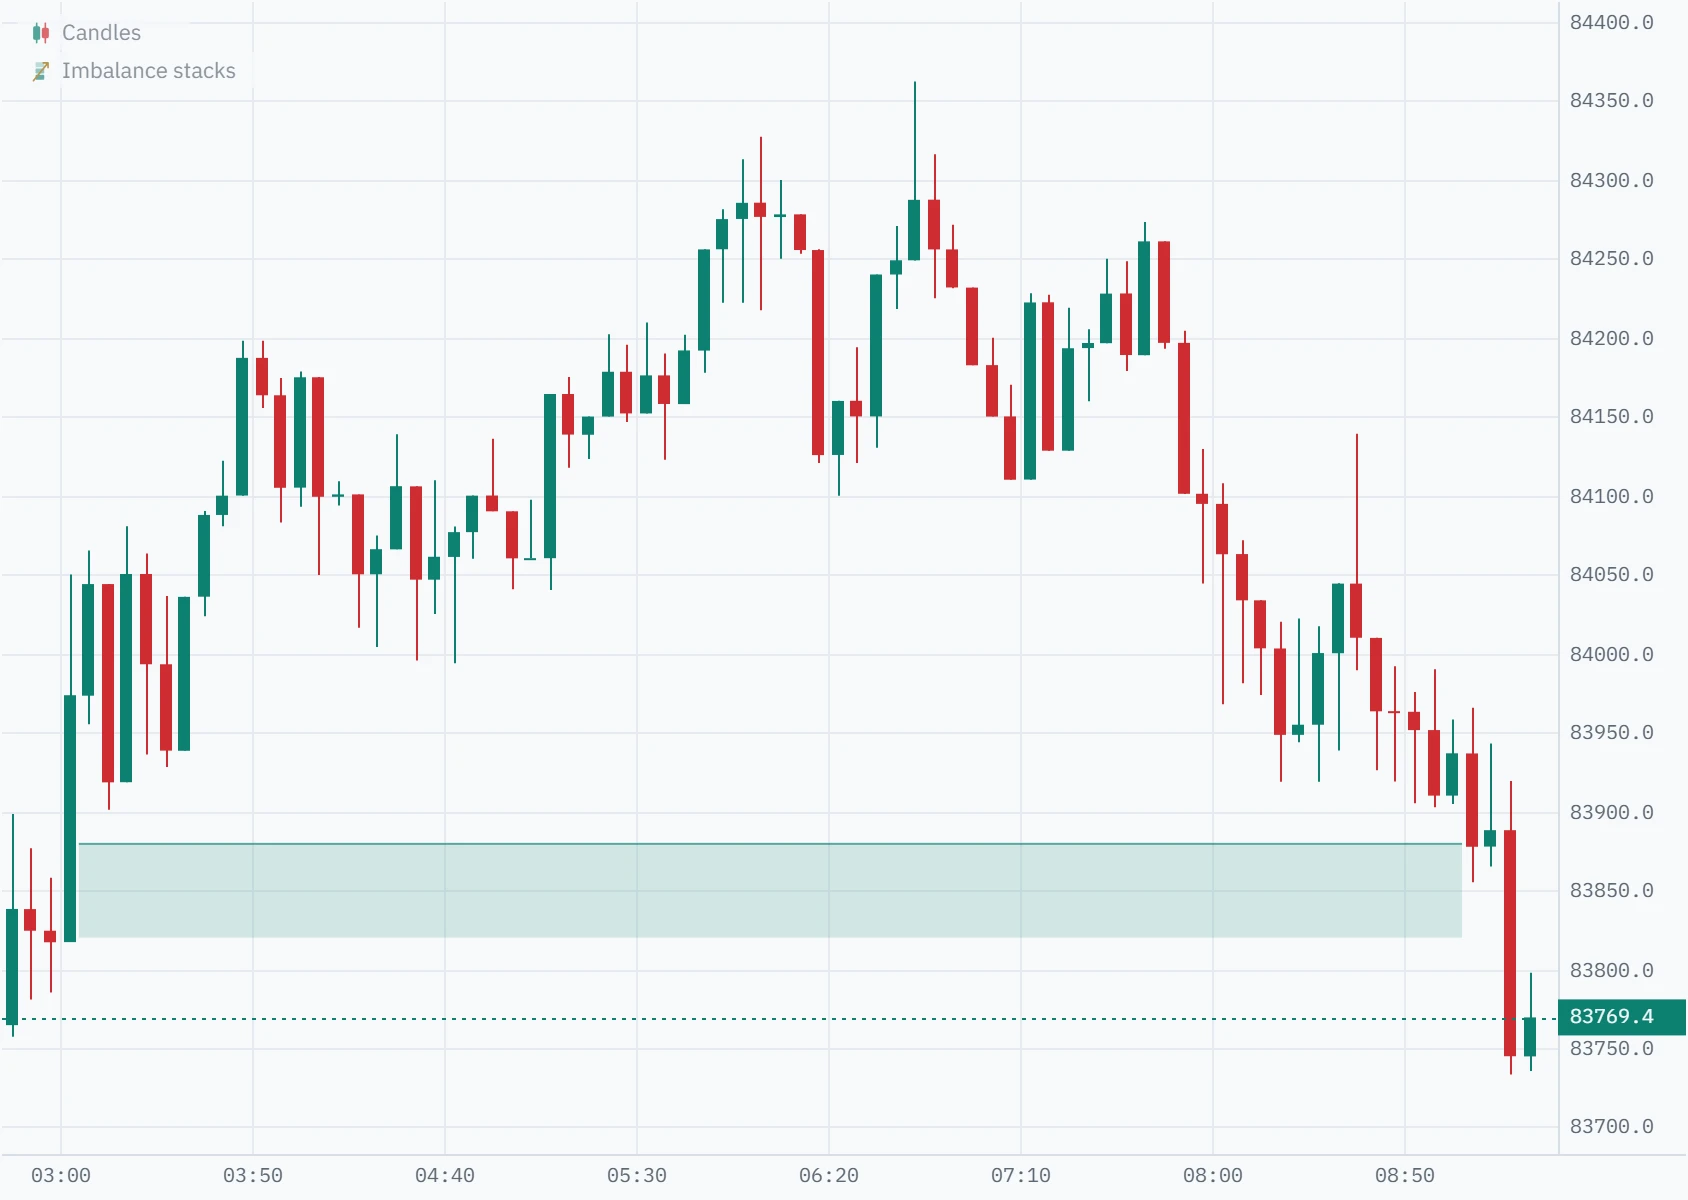
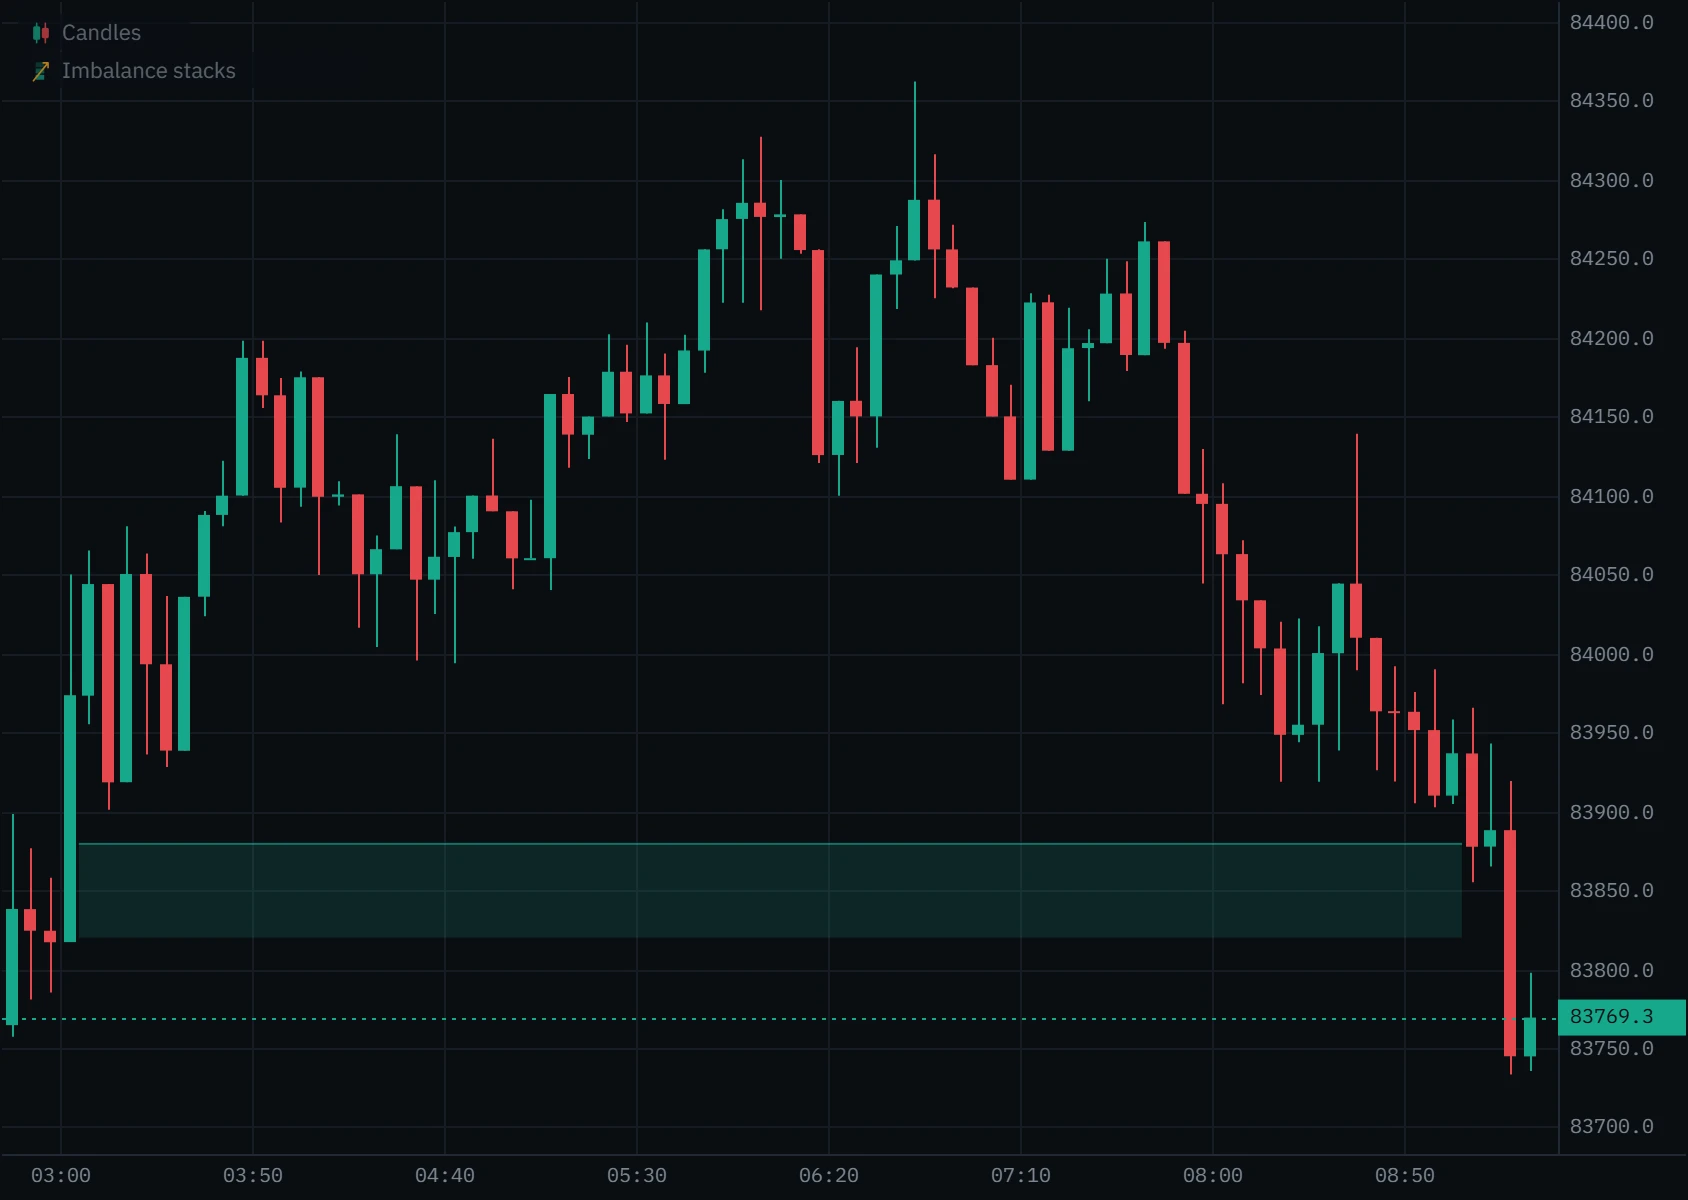
So the zone did its job once: the first two visits turned inside it. A trade from that defence, with the stop under 83,820, was stopped ten minutes later. That is the honest shape of the tool. A stack shows where one side was aggressive; it cannot promise they will be there again, and a level visited twice in quick succession is weaker each time.
Stacked imbalance vs ICT imbalance and fair value gaps
The word imbalance means two different things in trading. In ICT and smart-money teaching, an imbalance or fair value gap is a gap between candles: three candles where the wicks of the first and third do not overlap, drawn from prices alone. An order-flow imbalance is read from the trades inside one bar, by side.
| Stacked imbalance | Fair value gap (ICT) | |
|---|---|---|
| Built from | Trades by aggressor, inside one bar | Three candles’ highs and lows |
| Needs | A footprint: the exchange’s tape | Any price chart |
| Says | One side outtraded the other across a band | Price moved fast enough to leave a gap |
| Can disagree | A gap can hold no stack; a stack can sit inside an ordinary candle |
Set it up in Klustra
Open the chart
Go to the chart and choose an exchange and market. Stacked imbalances work on every exchange and on spot and perpetuals alike, free and with no account.
See the stacks on the footprint
Choose Bid×Ask in the toolbar. Imbalances are underlined in their cells; stacks get a rail on the side that made them.
Add the zones
Open Indicators and pick Imbalance stacks under Order flow. It works on candles too.
Tune the two settings
The gear beside Imbalance stacks in the chart’s legend opens the ratio and the stack minimum. They are the footprint’s own settings, so rails and zones always agree.
Get an alert (Pro)
In Alerts, choose Imbalance: how many stacked levels, the ratio and the side. It fires once per bar, the moment the stack appears, while a chart on that market is open in your browser.
Every setting
| Setting | Default | Range | What it changes |
|---|---|---|---|
| Imbalance ratio | 3 | 1.5 to 10 | How lopsided the diagonal must be, in steps of 0.5: 3 means the winning side traded at least 300% of the other. Against zero always counts. |
| Stacked imbalance minimum | 3 | 2 to 10 | How many imbalances at consecutive prices make a stack, and so a rail and a zone. |
Common mistakes and limits
- Trusting every stack on fine rows. At $2 rows on the Bitcoin perpetual, two bars in three hold a stack. Raise the minimum or zoom out before reading them as levels.
- Forgetting that zoom changes rows. Rows follow the zoom, so a stack can split or merge when you zoom. Compare stacks at the same zoom.
- Acting on a forming bar. A stack in the bar still trading can dissolve before the close. Zones wait for the close; the alert does not, by design, so treat it as a heads-up.
- Mixing spot and perpetual. Each is its own tape with its own aggressors. A stack on the perpetual says nothing about spot.
- Expecting zones in a candle replay. Bar replay on candles reads exchange candles, which carry no order flow. Replay on the footprint shows rails and zones from the bars revealed so far.
- Looking further back than the order flow. Free order flow reaches back six hours; older bars are candles without trades, so they make no stacks. Pro adds the archive for covered symbols.
Klustra and other footprint platforms
Every footprint platform marks diagonal imbalances, and most can highlight stacks; some extend them as levels until price returns. In Klustra the rails and the zones are free, in the browser, with nothing to install, on seven exchanges. If you are coming from another platform, the comparisons cover what carries over: Klustra vs Exocharts and Klustra vs TradingLite.
Free and Pro
Stacked imbalances, on the footprint and as zones, are part of the free chart, with the footprint, delta and CVD. Pro adds alerts and the deep order-flow archive.
| Feature | Free | Pro |
|---|---|---|
| Bid-ask imbalance and stacked imbalances | Included | Included |
| Footprint chart (bid × ask) | Included | Included |
| Delta | Included | Included |
| CVD | Included | Included |
| Price and order-flow alerts in the browser | Not included | Included |
| Order-flow history | Last 6 hours | Deep archive, where covered |
Questions
What is a stacked imbalance?
Three or more neighbouring prices in one footprint bar where the aggressive buying was at least three times the selling one price lower, or the selling three times the buying one price higher. It marks a band of price one side took by force.
What is a bid-ask imbalance?
A price where one side outtraded the other on the diagonal: the market buying at a price against the market selling one price step lower, or the selling at a price against the buying one step higher. Klustra marks it at 3× by default.
Why is the imbalance read diagonally?
Because those are the two sides of the same spread. A buyer at the offer meets sellers resting one step above the best bid; the selling that competes with that buyer is selling into the bid one price lower, not at the same price.
What is a good imbalance ratio?
Most traders use 2.5× to 4×; Klustra defaults to 3×. On fine rows the ratio matters less than the stack length and the row size: raising the minimum to four, or zooming out a step, removes far more noise than a higher ratio.
How many levels make a stacked imbalance?
Three is the usual minimum and Klustra’s default; you can set two to ten. The levels must be consecutive prices: a price that never traded breaks the run.
Are stacked imbalances support and resistance?
Often treated that way, conditionally. A buy stack below price can act as support on the first return, a sell stack above as resistance. On the Bitcoin perpetual on 6 October 2026 the first return stayed inside the zone 30% to 67% of the time, depending on row size. Treat a zone as a place to watch, not a place to buy.
Why did my stacked imbalances change when I zoomed?
Rows follow the zoom: zoom out and each row covers more ticks, so imbalances are measured on bigger rows and stacks can merge or disappear. The trades are the same; the grid they are counted on is not.
What does an imbalance against zero mean?
Buying at a price where nothing was sold one row lower, or the reverse. It counts as an imbalance at any ratio, which is why thin rows produce so many of them.
Is a stacked imbalance the same as a fair value gap?
No. A fair value gap is a gap between three candles’ wicks, read from prices alone. A stacked imbalance is read from the trades inside one bar, by side. They can coincide, but neither implies the other.
Is the stacked imbalance indicator free?
Yes. The footprint’s imbalances and stacks and the Imbalance stacks zones are free, on every exchange Klustra supports, with no account. Alerts on stacked imbalances are part of Pro.
Related tools
See it on a live market.
Open a supported market and switch the tool on. The footprint, delta, CVD and imbalances are free, with no account.
Order flow shows what traded, not what will trade next. Nothing on this page is financial advice, and trading carries a real risk of loss.