
Cumulative volume delta, or CVD, is delta added up bar after bar: the running total of market buying minus market selling. Klustra draws it in its own pane under the chart, as candles whose wicks show how far it ran inside each bar, and marks the bars where price broke out and CVD did not follow.
What CVD is
Every trade has a buyer and a seller. What differs is who crossed the spread: one side was resting in the book, the other took it, and the exchange marks that second side, the aggressor, on every print. A bar’s delta is the aggressive buying in it minus the aggressive selling. CVD keeps adding: each bar’s delta on top of the total so far.
So where delta answers “who pushed harder in this bar?”, CVD answers “who has been pushing, and is it still going their way?”. Three bars of +120, −40 and +60 leave CVD 140 higher than where it started. Traders call it cumulative delta, CD or the CVD line. Its level means little on its own, because it depends on where the count began. Its direction and shape are the reading, and above all how they compare with price.
How Klustra builds it
Your browser connects to the exchange’s public trade stream and receives every print with its size and aggressor side. A Web Worker adds each print to its bar, keeping the running delta after every print, and the CVD is arithmetic over those same bars: the footprint, the delta panel and the CVD can never disagree about a bar, because there is only one copy of it.
- Open: where CVD stood when the bar opened, the previous bar’s close.
- Close: the open plus the bar’s delta.
- High and low: the open plus the highest and lowest the running delta reached inside the bar. A bar that ran to +300 and closed at +40 has a long upper wick, and that wick is the information a line would throw away.
We checked the indicator before writing this page, on 1 October 2026. Auditing the delta panel the same day, every bar’s delta and volume compared equal to Binance’s own trade record, and each bar’s highest and lowest running delta equal to that record replayed print by print; the CVD adds those numbers up and draws them. The audit did find things to fix in the pane, all fixed before this page was written: on exchanges that publish no buy/sell split it had drawn a flat zero across their history, its histogram measured nothing, and on Bybit and Hyperliquid minutes the exchange could not supply had been drawn as minutes in which nothing traded.
Where each number comes from
The recent stretch of the chart is built from trades: six hours of order flow on Free, more with the Pro archive. Further back, bars are the exchange’s own candles, which carry less. The pane draws only what each kind of bar actually records.
| Bar built from | Body | Wicks | Divergence dots |
|---|---|---|---|
| TradesThe order-flow window | Yes | Yes | Yes |
| Binance candlesOlder history | Yes | No | Yes |
| Other exchanges’ candlesBybit, OKX, Bitget, Gate.io, Hyperliquid, Coinbase | Nothing drawn | No | No |
| Archived daysPro, at 1-minute bars and longer | Yes | No | Yes |
Where the count starts
By default the pane counts from the first bar the chart loaded, so its numbers move when you reload, change timeframe or scroll into older history. Switch on Reset each UTC day and it restarts at zero at every 00:00 UTC instead, on any timeframe shorter than a day: the pane then reads as the day’s CVD, and at the live edge it gives the same number as the CVD in the status bar at the bottom of the chart. Wherever a stretch of bars was never measured, the next measured run starts from zero as well, because carrying the level across would claim the gap netted nothing.
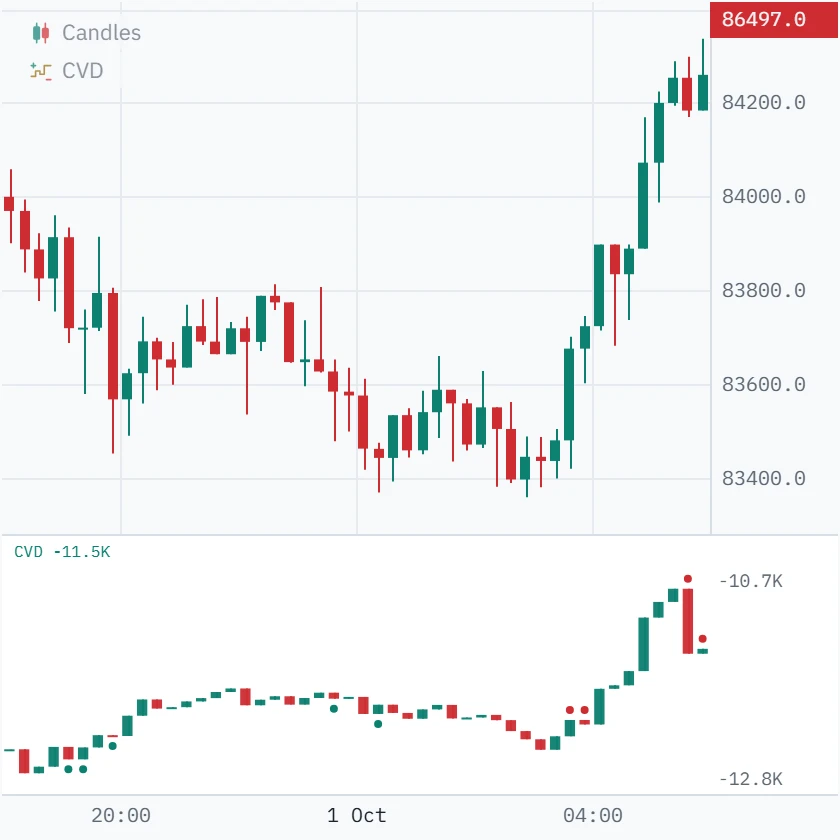
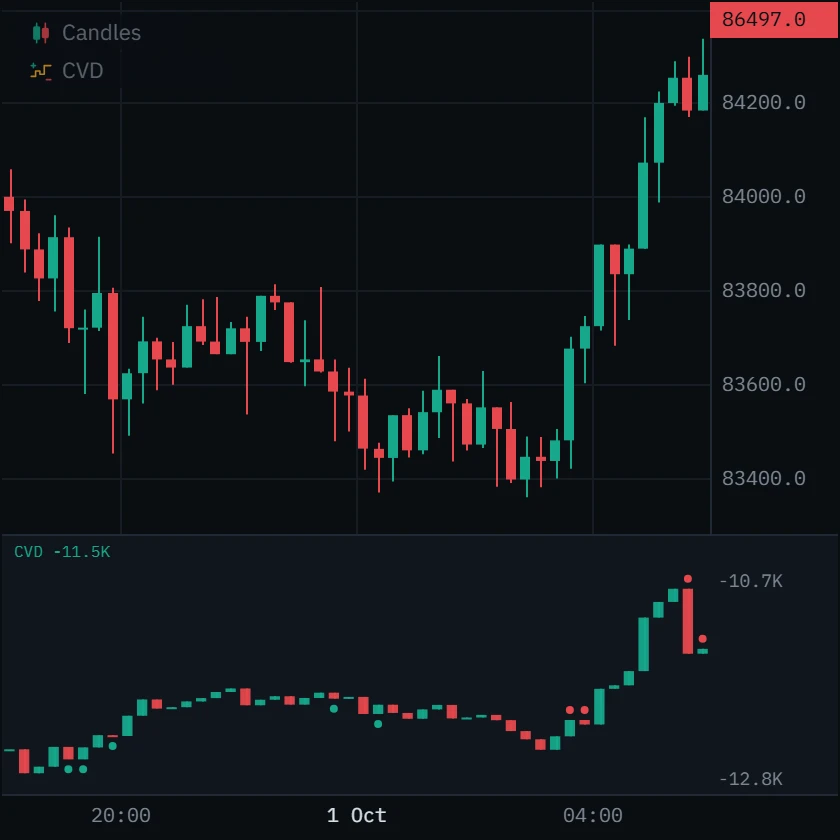
One unbroken run. Good for seeing who has been in control over several days.
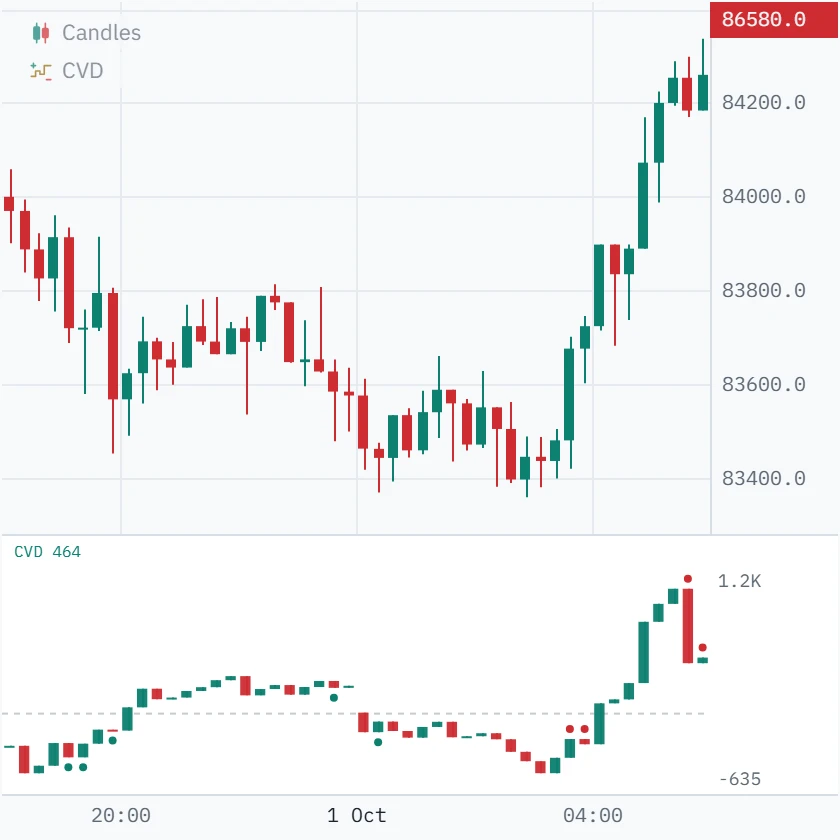
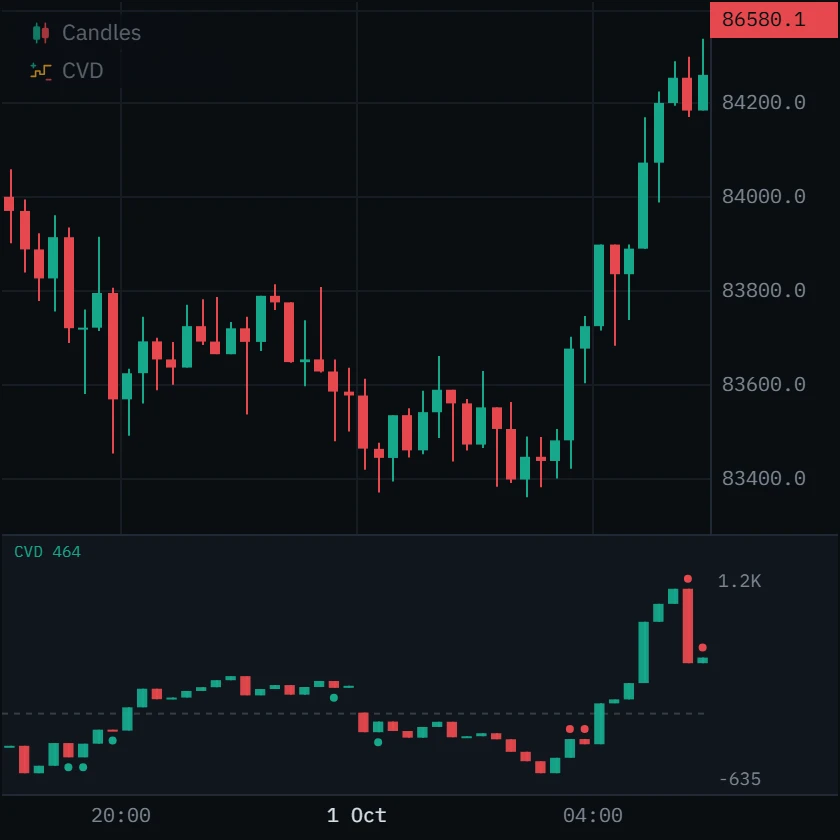
The count drops to zero at 00:00 UTC and starts again. Good for comparing one day with the next, and for reading the session’s number.
The same fifteen-minute Binance candles either side of 00:00 UTC on 1 October 2026, with the reset off and on.
Anatomy of the pane
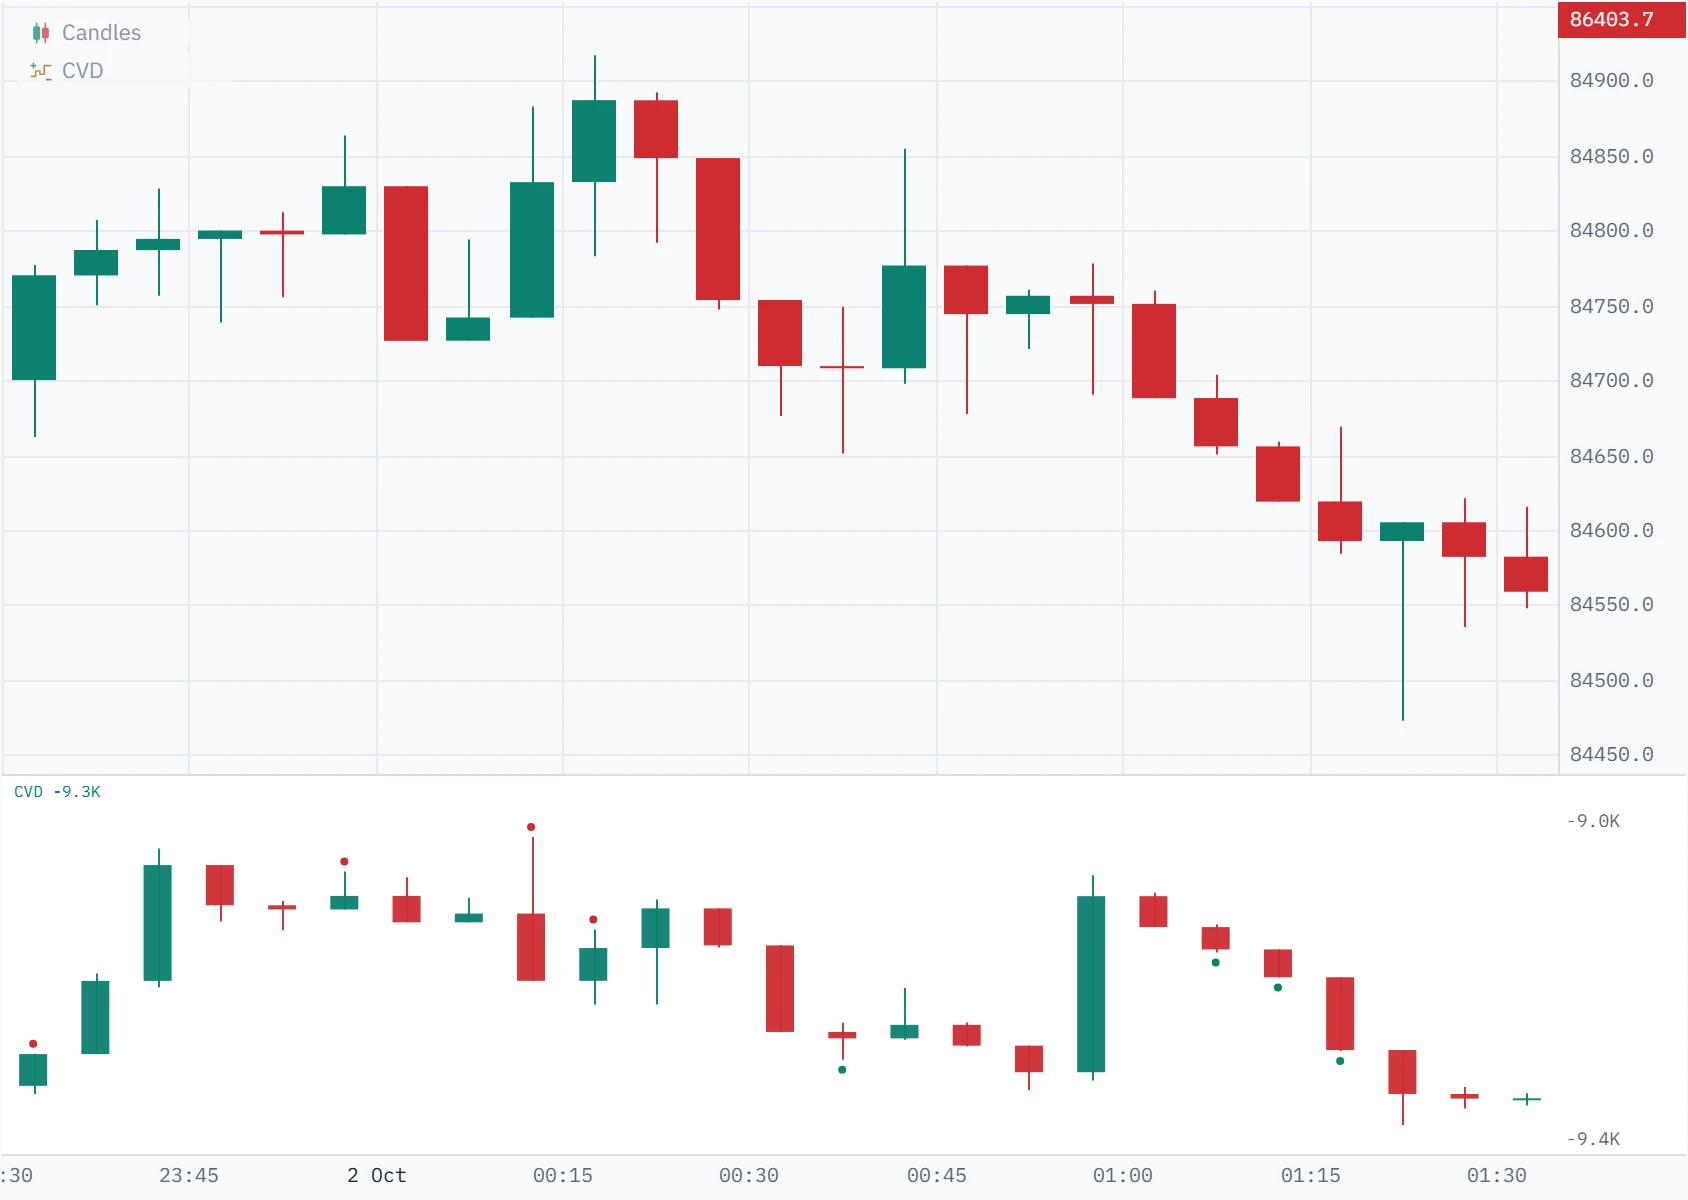
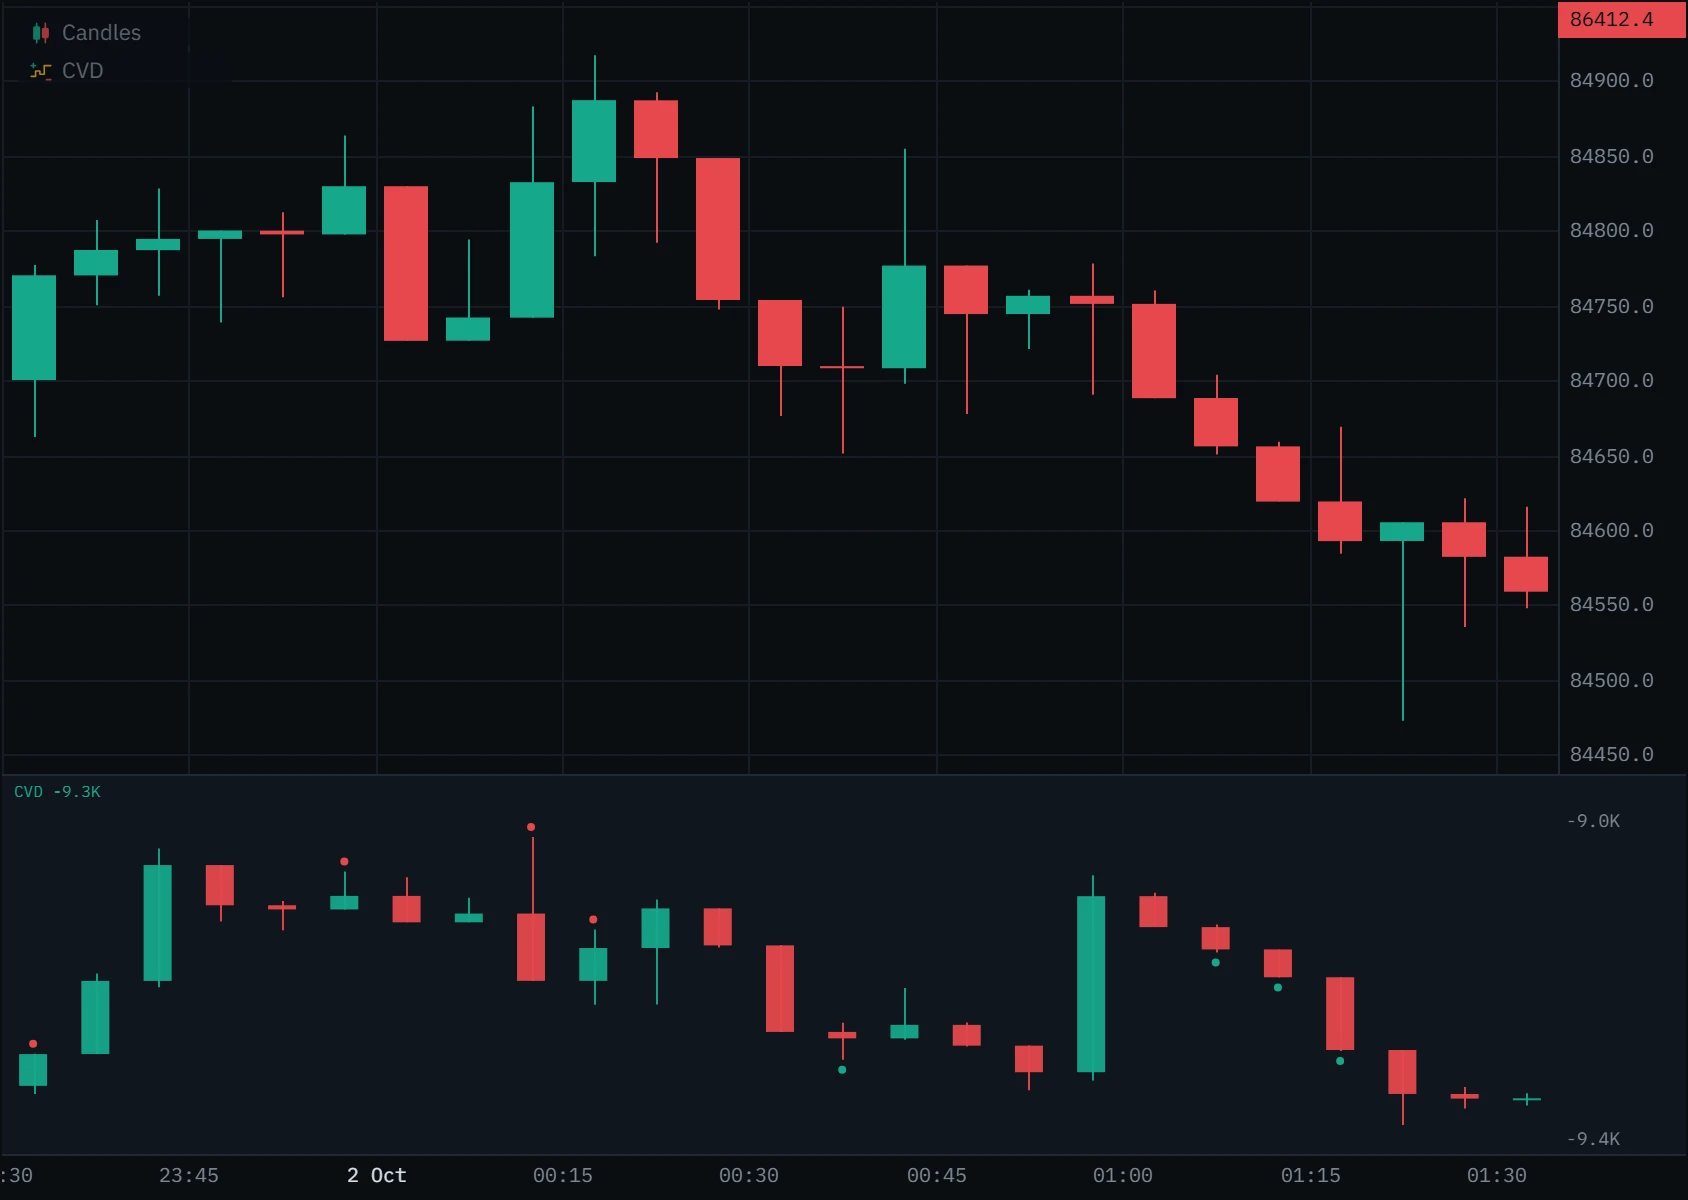
One CVD candle per price candle, in the same column. Open each mark on the picture below.
Candles, line or histogram
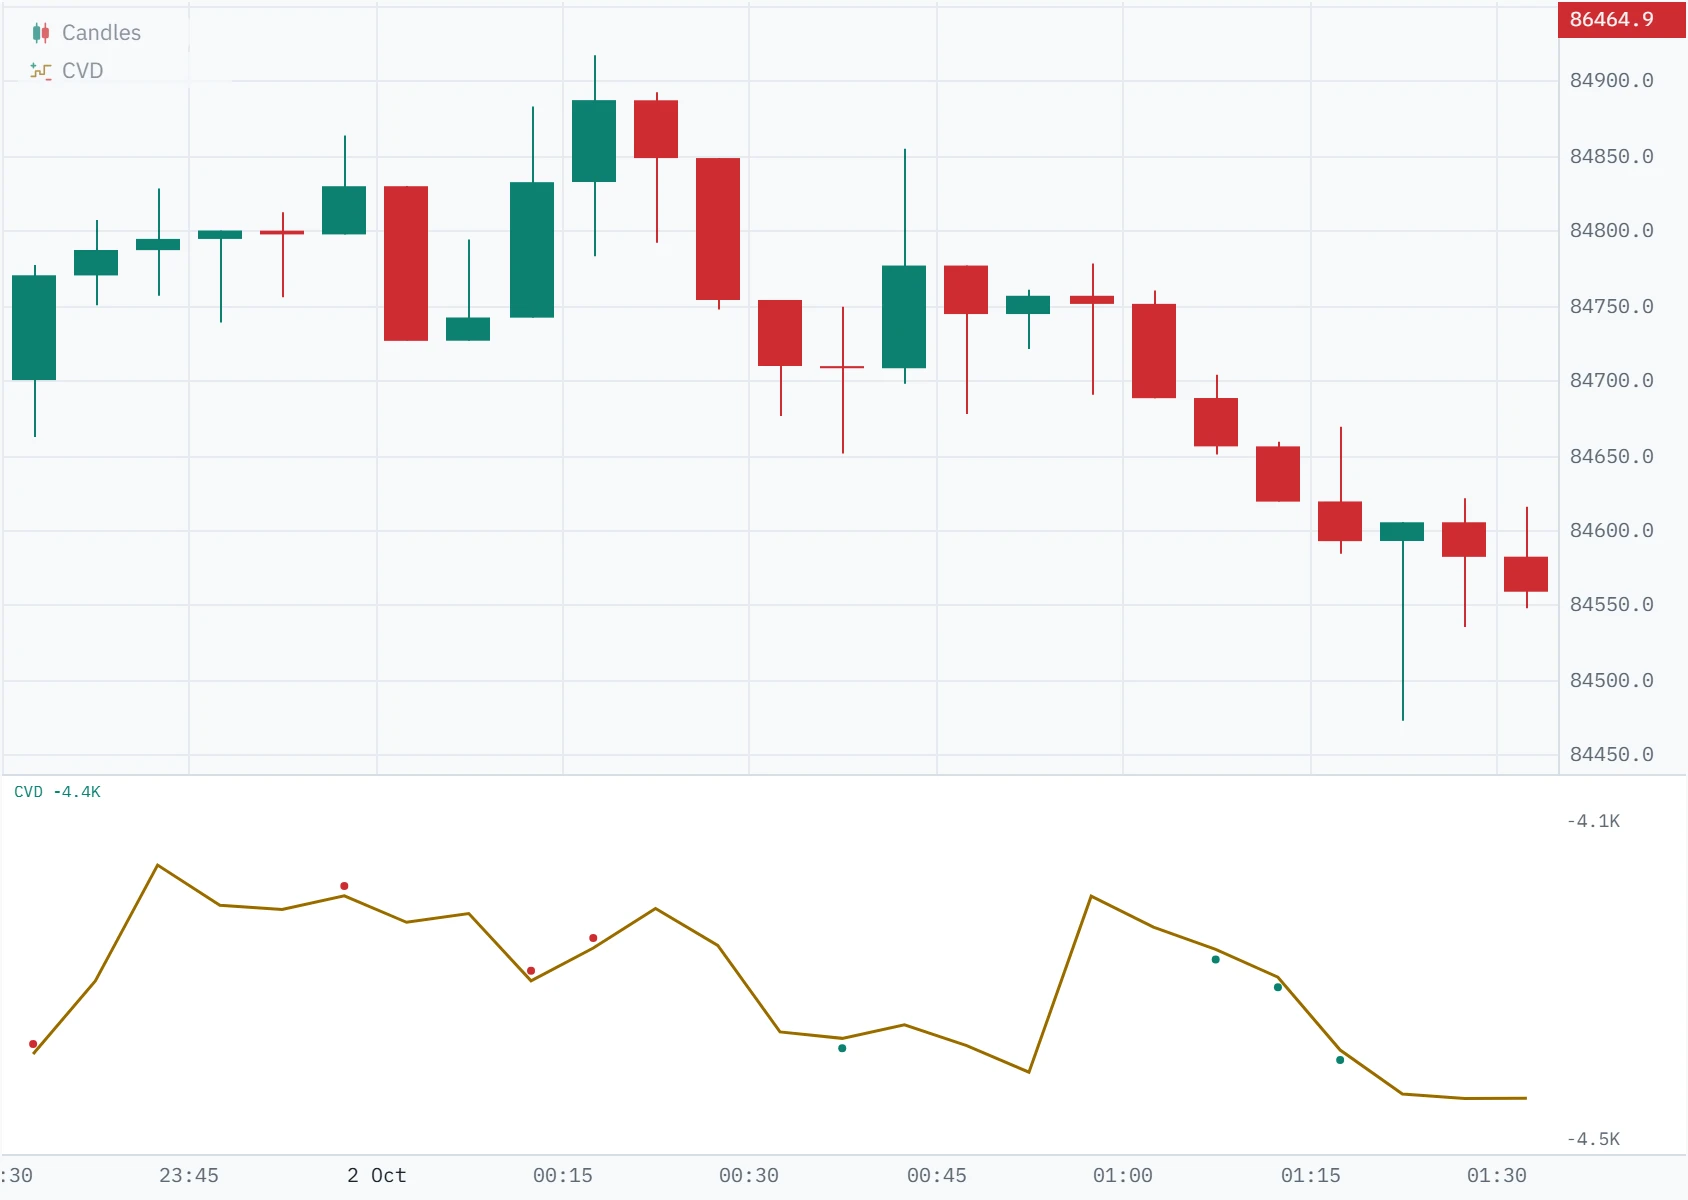
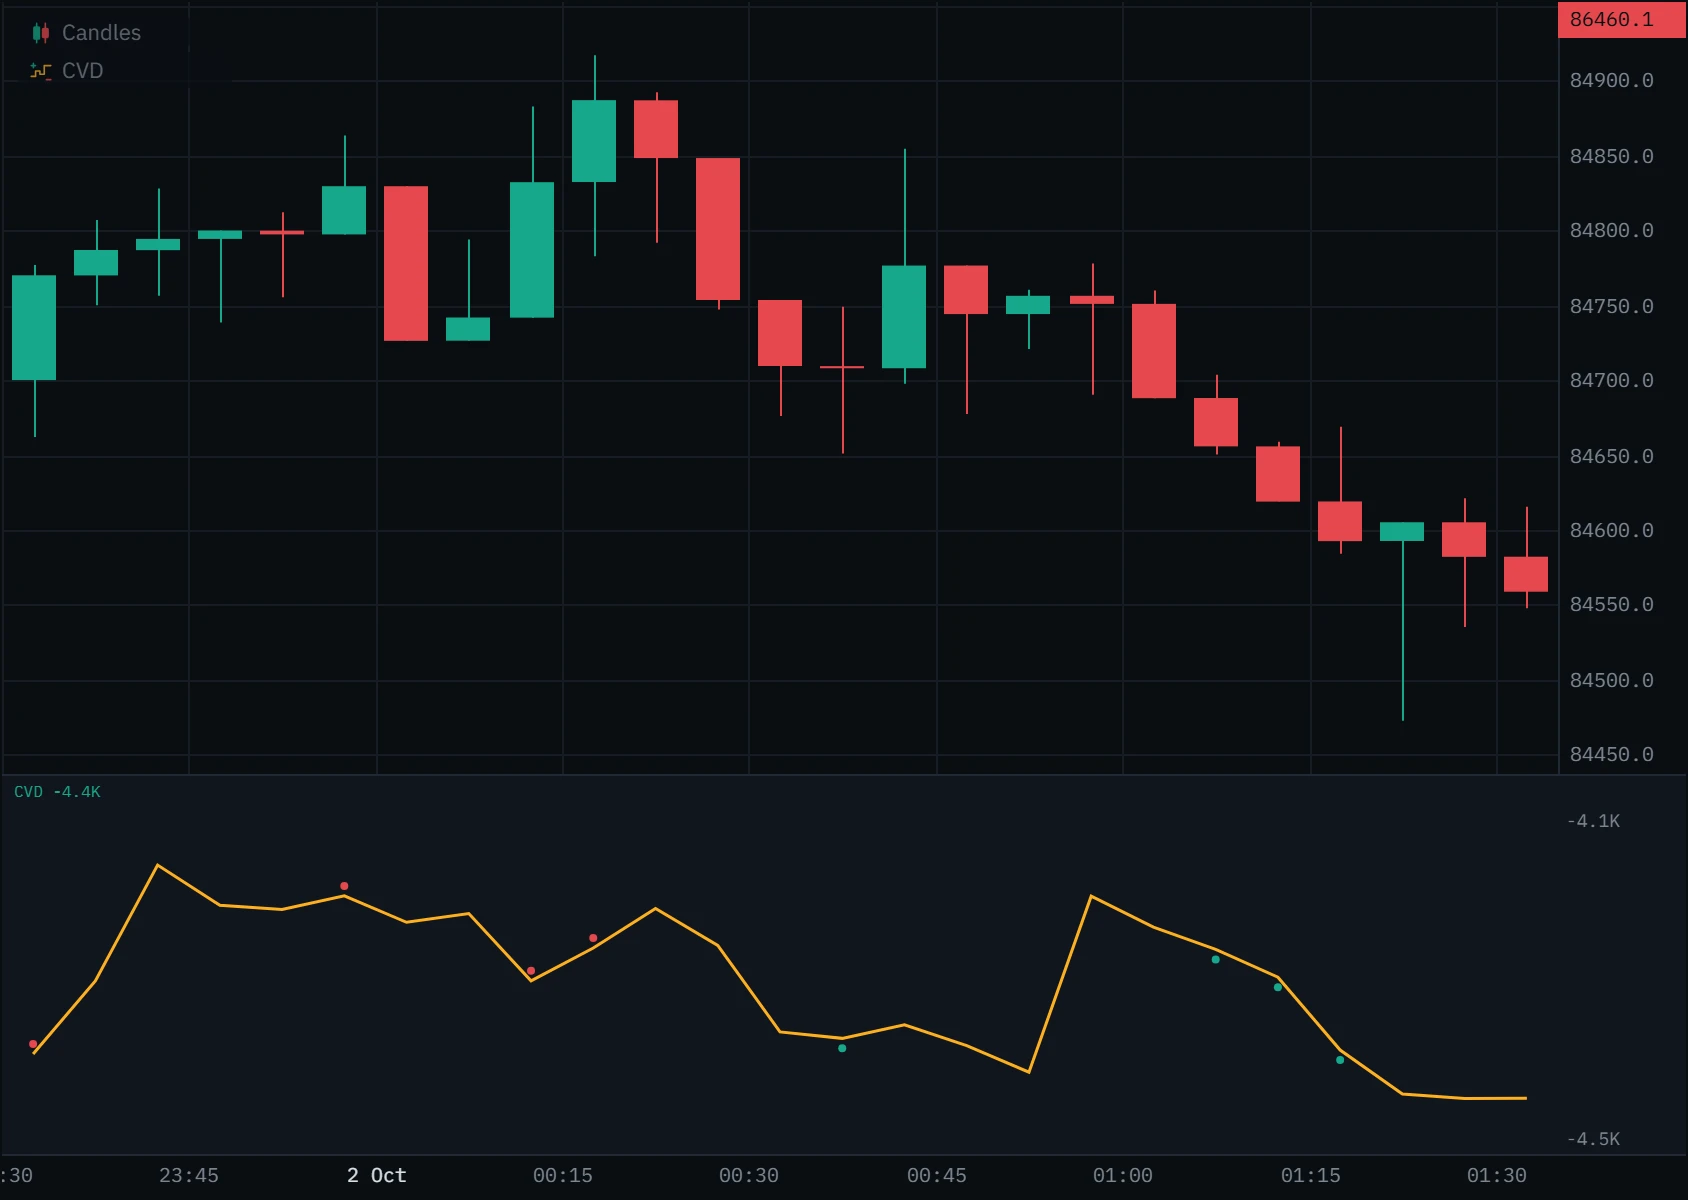
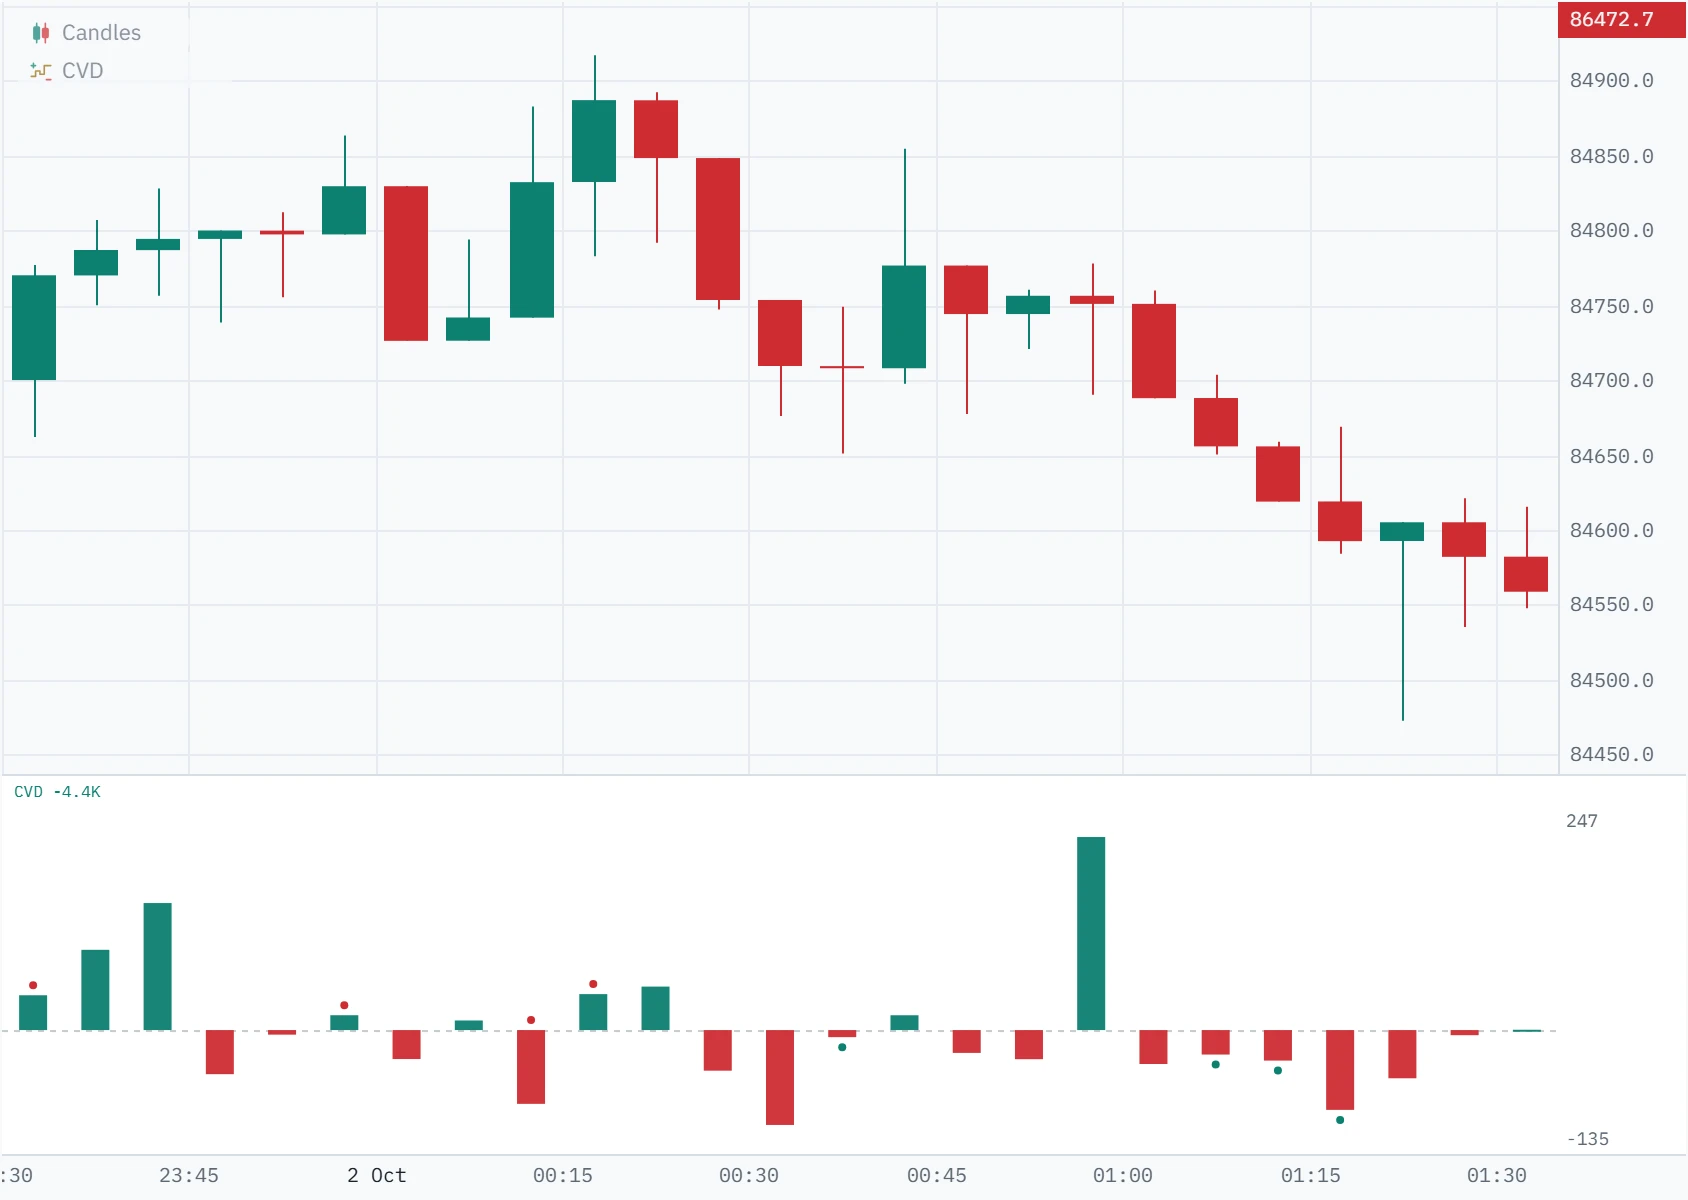
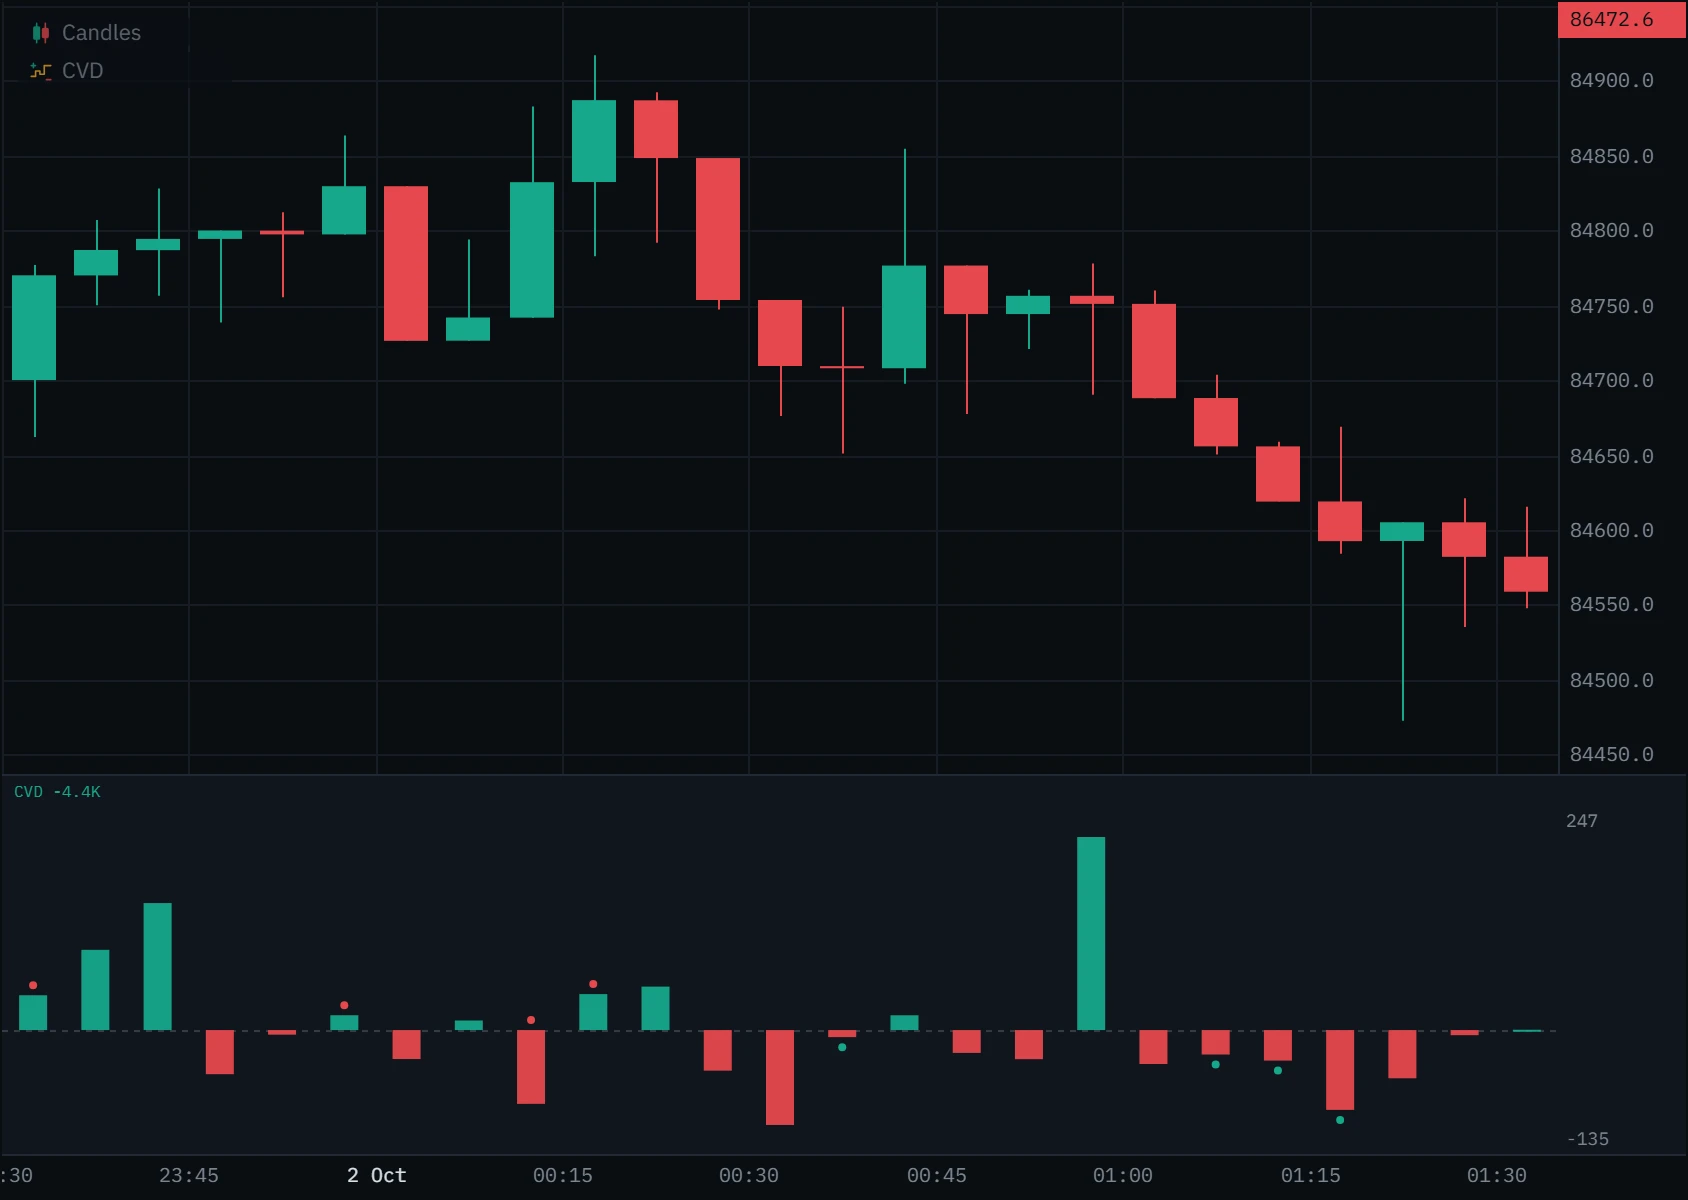
Three ways to draw the same numbers. The candles are the default because they keep what happened inside each bar.
Four things to look for
CVD is most useful as a comparison with price. Each of these is a question to ask at a level you already care about, not a trade on its own.
Price and CVD rising together: buyers are lifting the offer and price is giving way to them. That is a trend with aggression behind it, the ordinary case, and the one the others are measured against.
- Look for
- Higher highs in price and in CVD
- It weakens when
- CVD keeps rising but price stops answering
What the dots mean
A red dot above a CVD candle marks a bar whose price went higher than the highest high of the 14 bars before it, while its CVD closed below the highest close CVD made over those bars. A green dot below marks the mirror image: a new low in price on a CVD that stayed above its low. The 14 is the Divergence lookback setting; 0 switches the dots off.
- They are frequent on short timeframes. On the BTCUSDT perpetual on 1 October 2026 the default lookback marked 43 one-minute bars in six hours and twenty minutes, about one every nine minutes, and 7 five-minute bars in six and a half hours. On a one-minute chart, raise the lookback.
- The newest bar’s dot can come and go. It is judged on the bar still trading, so a dot that appears mid-bar can vanish by the close. Every dot to its left is final.
- The daily reset never makes one. Dots compare the unbroken running total, so restarting at midnight cannot pass for a divergence.
- They need measured bars. A comparison that would reach a bar with no buy/sell split is not made.
Using it in your trading
CVD earns its place at the edges: a range high, a level price has turned at before, yesterday’s low. In the middle of a range, price and CVD wander together and disagree often, and it means little.
Choose the level first
Mark where a reaction would matter on candles or a higher timeframe, before you look at CVD.
Watch how CVD arrives
Is price reaching the level on rising CVD, with aggression behind it, or drifting there while CVD flattens?
Treat a dot as a prompt
A divergence at your level is a reason to look closer, not to act. Away from a level, ignore it.
Look inside the bar
The footprint shows where at the high the buying printed, and the delta panel whether it held to the close.
Let price confirm
The next bars failing to extend is the confirmation; a stop goes beyond the extreme the divergence was made at.
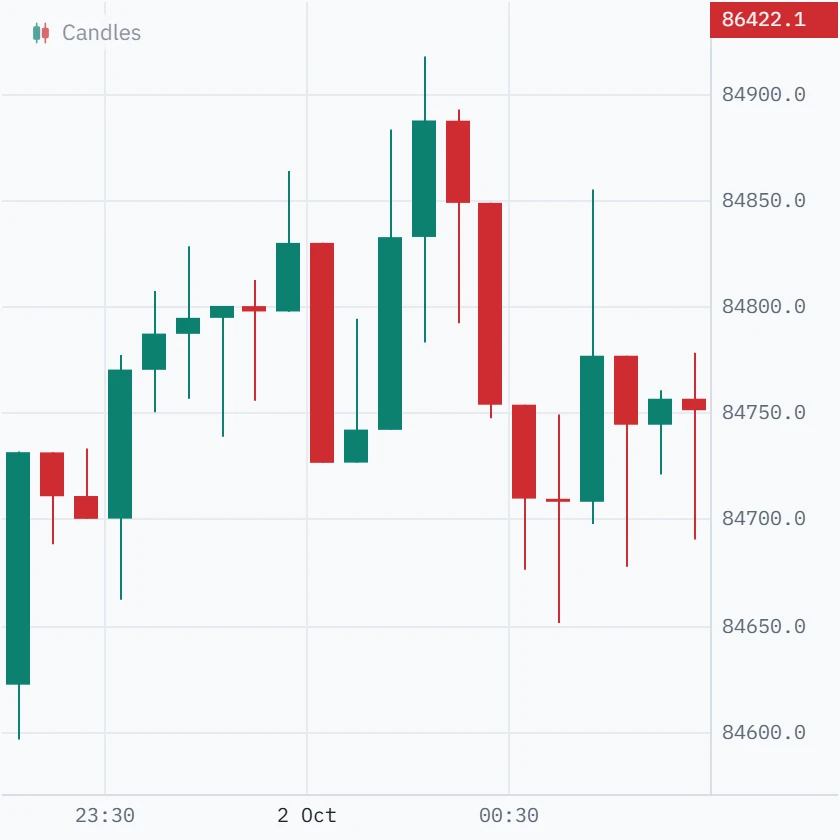
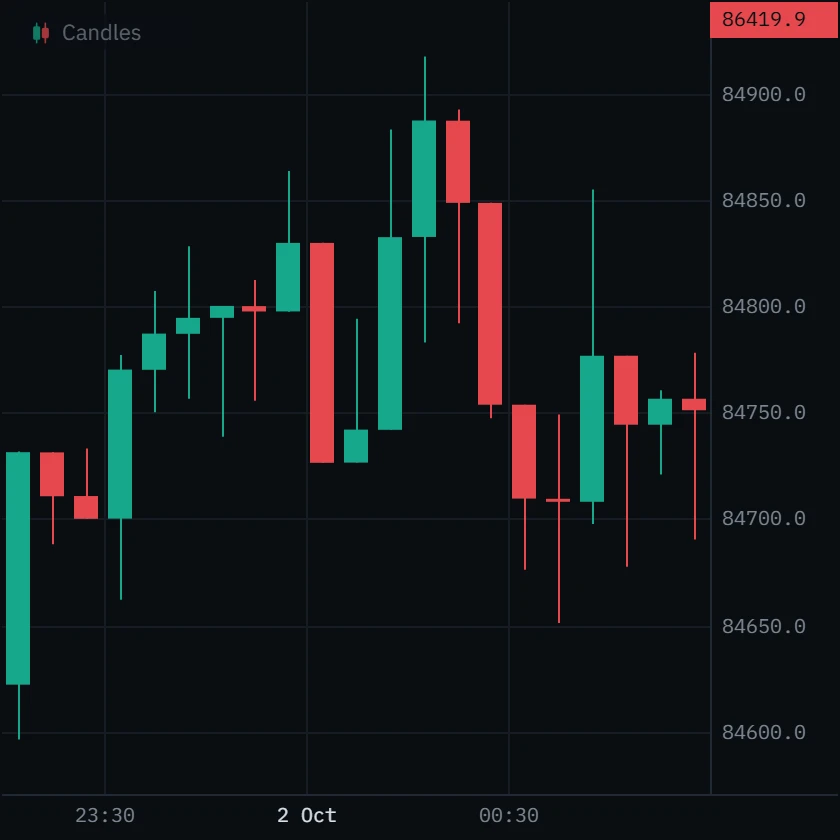
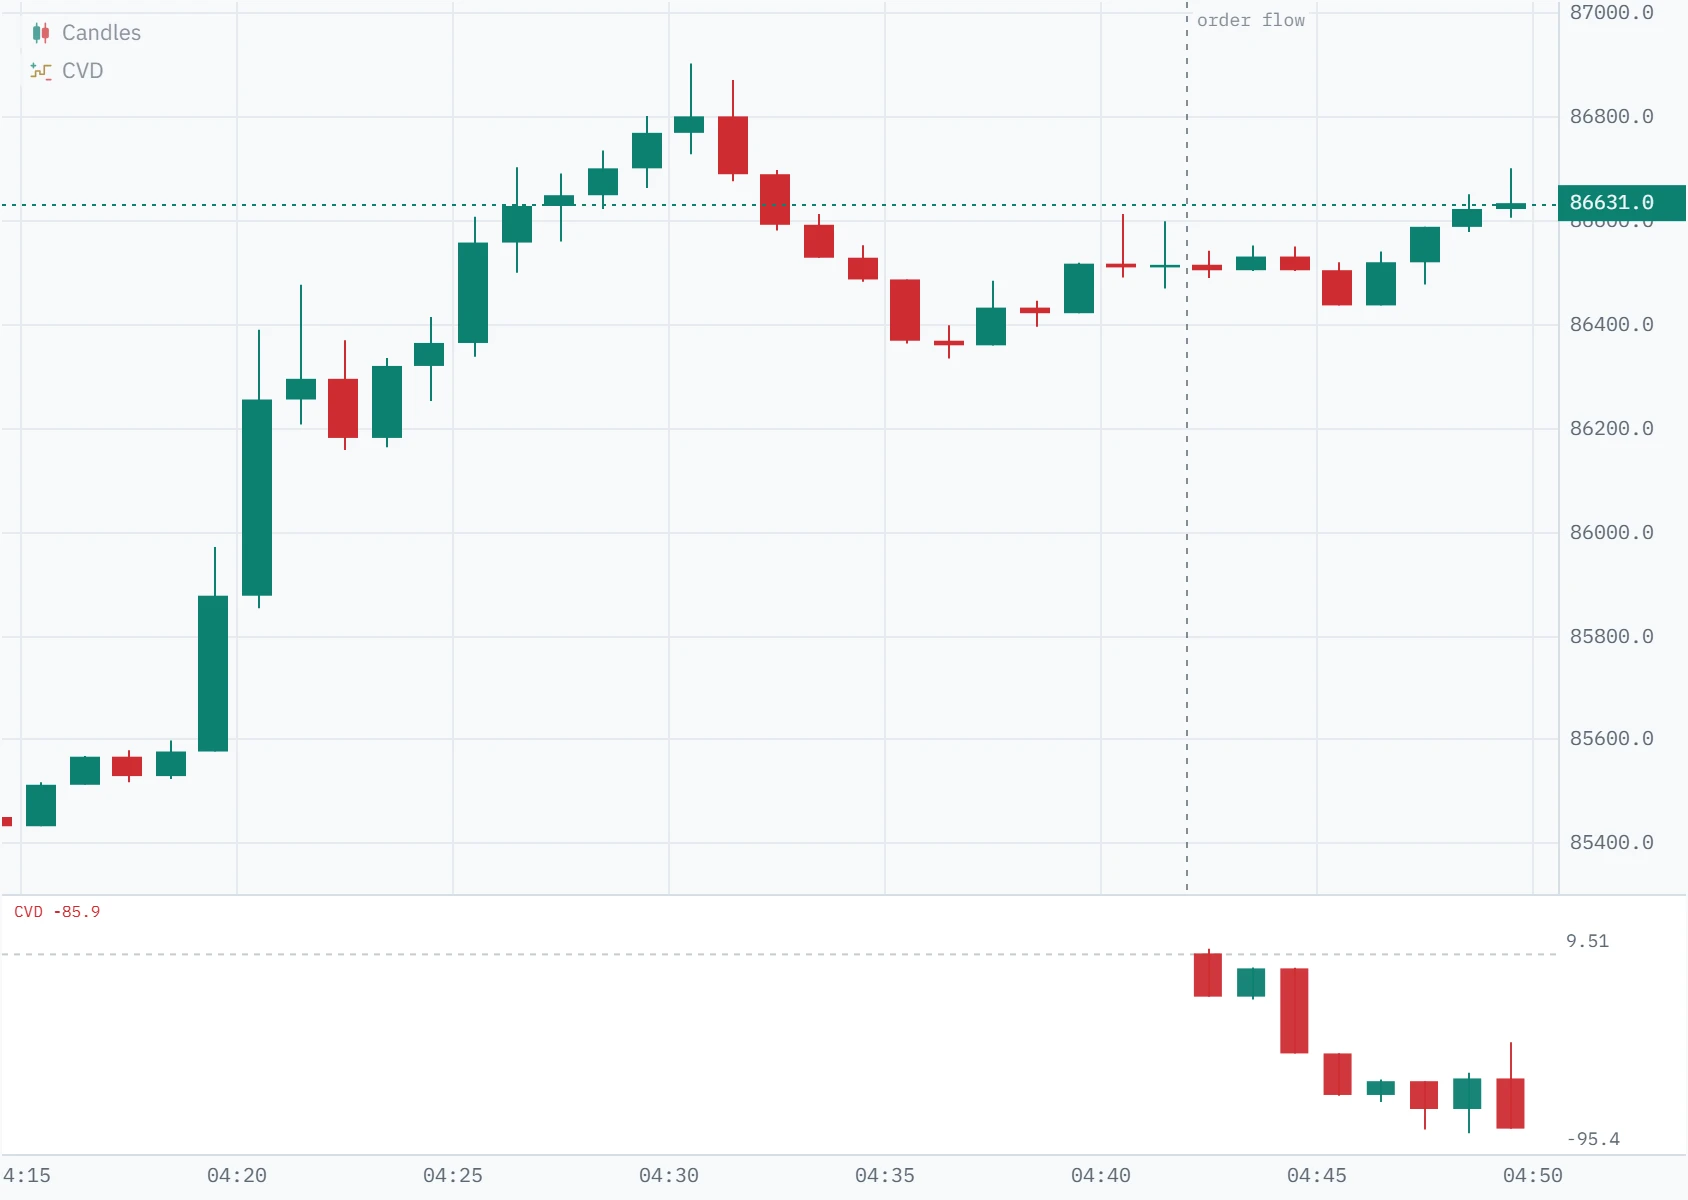
At 00:15 price made a new high at 84,917, above every bar of the hour before. On price alone, buyers were winning.
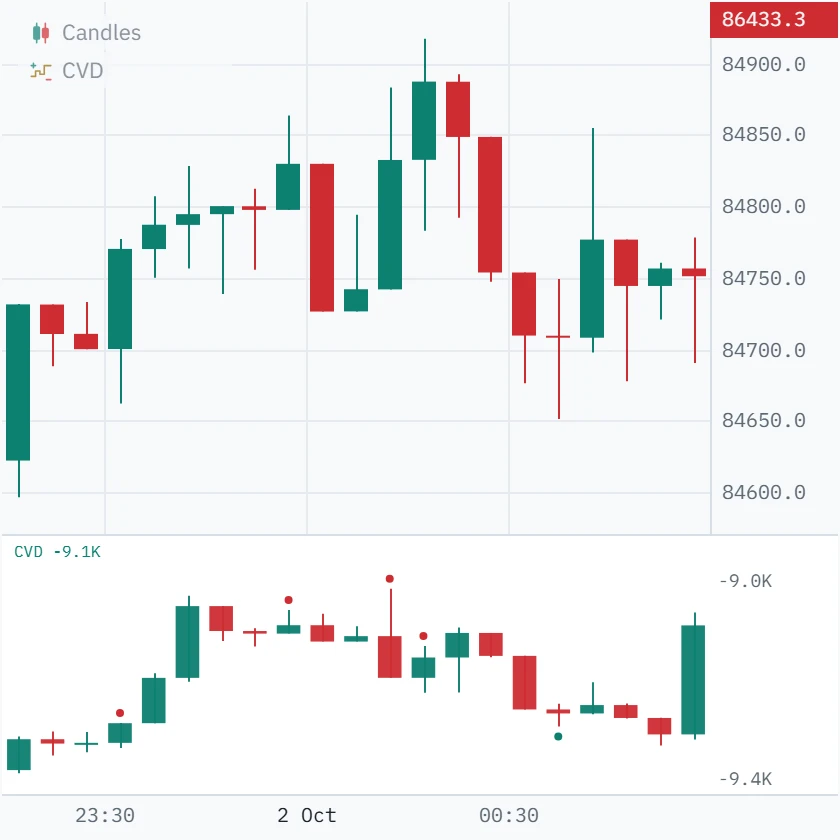
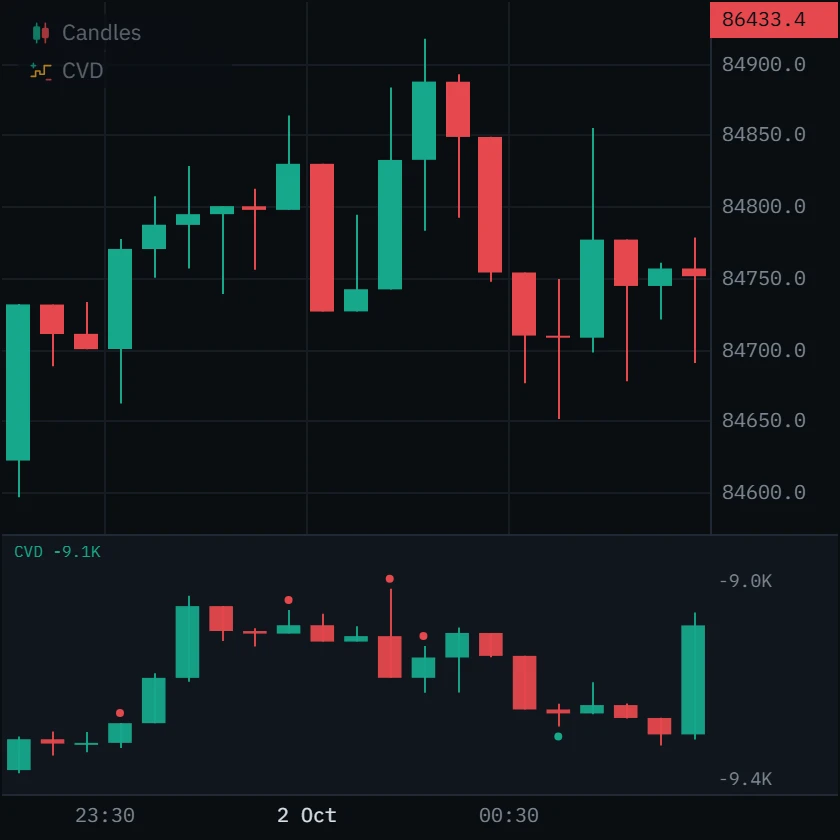
CVD closed 104 below its 23:40 peak: the push to the new high had less aggression behind it than the one forty minutes earlier. The red dots mark it. Over the next 25 minutes price fell to 84,651, 236 under that close, and the high held.
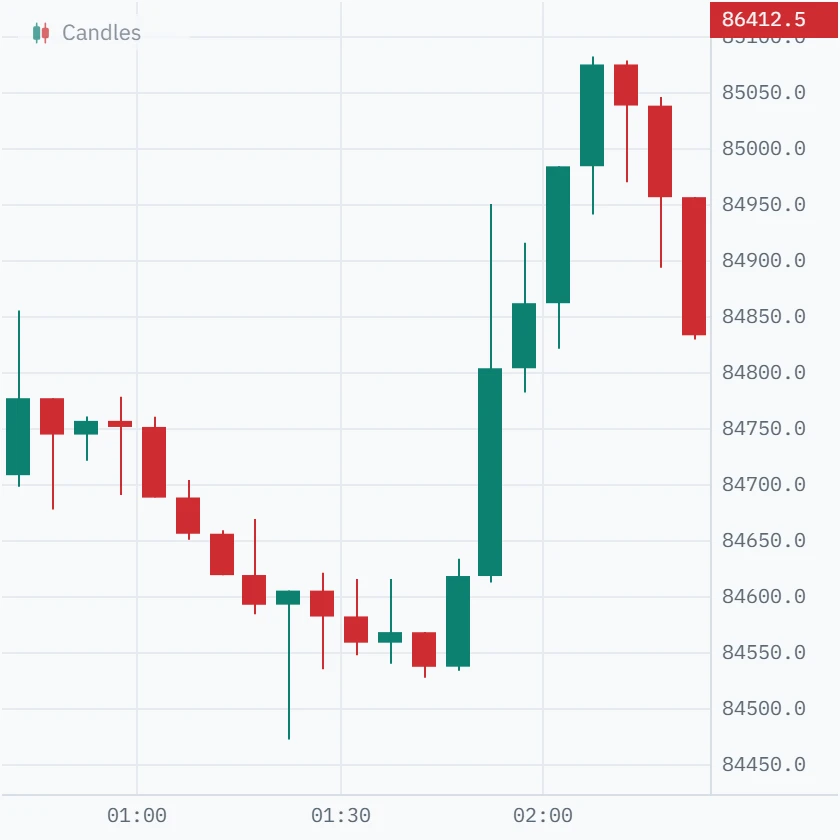
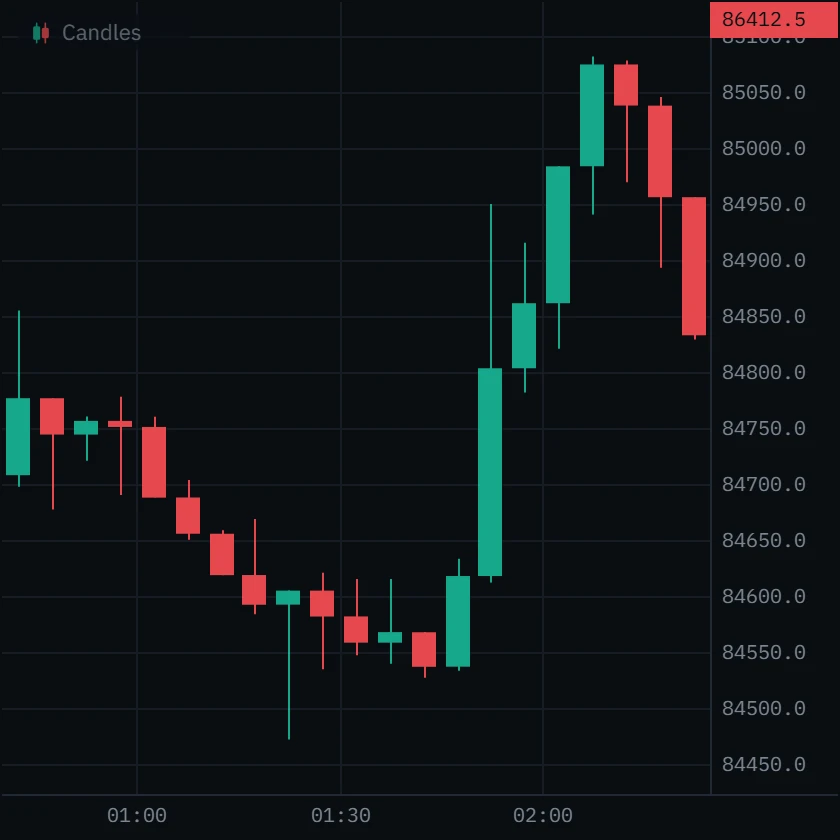
At 01:50 and again at 02:00 price pushed to new highs, 84,950 and then 84,983.
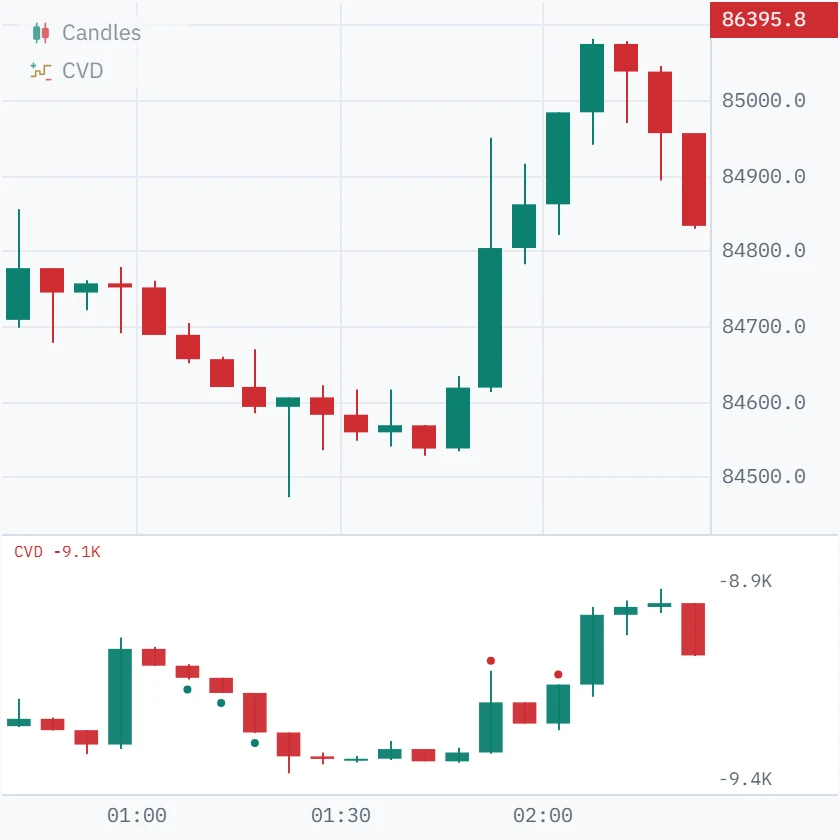
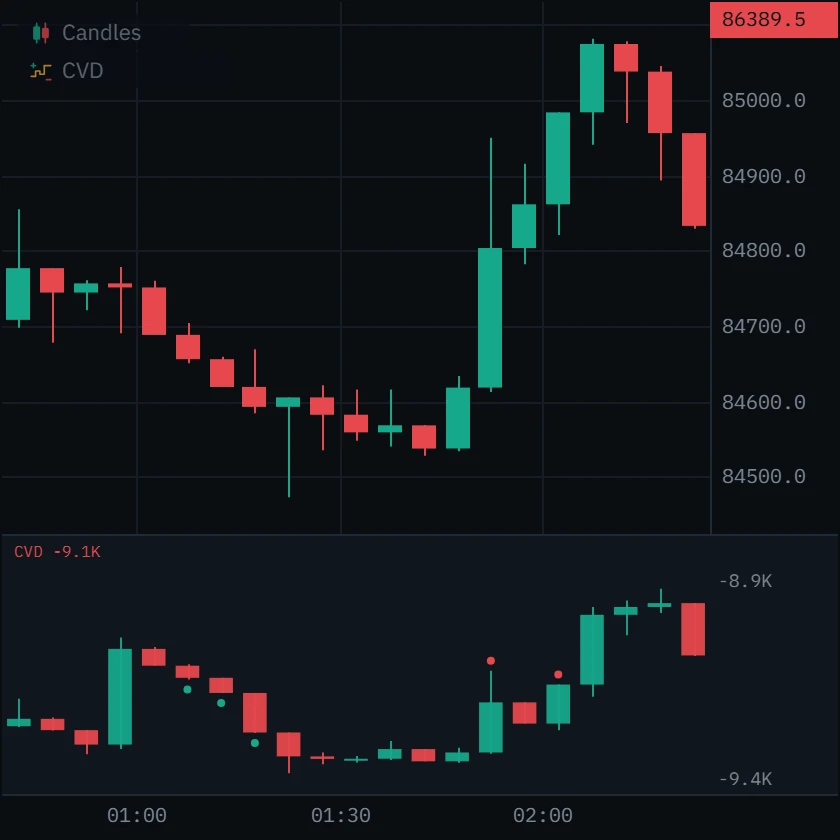
Both bars carry a red dot: CVD stayed under its 00:55 peak. One bar later, at 02:05, price reached 85,081 on +161 delta and CVD made a new high of its own, and the divergence stopped meaning anything. By 04:30 price was at 86,888.
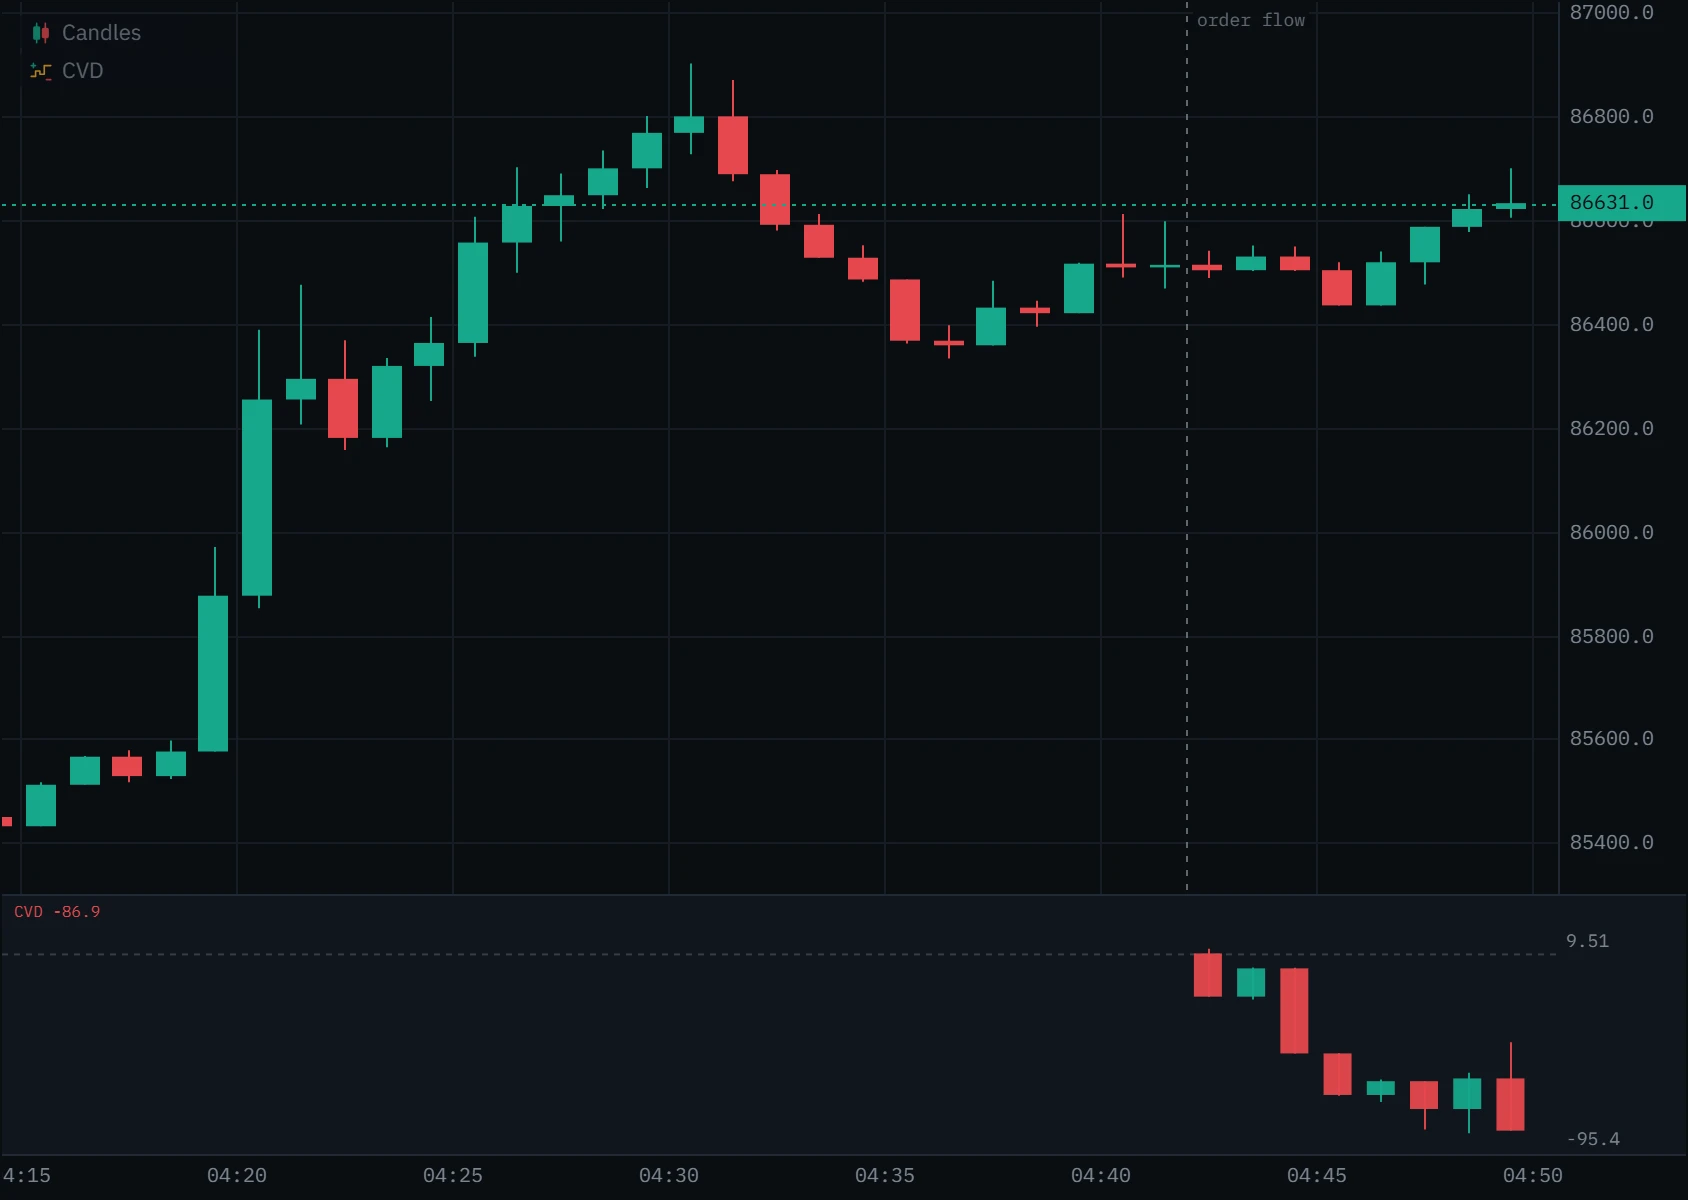
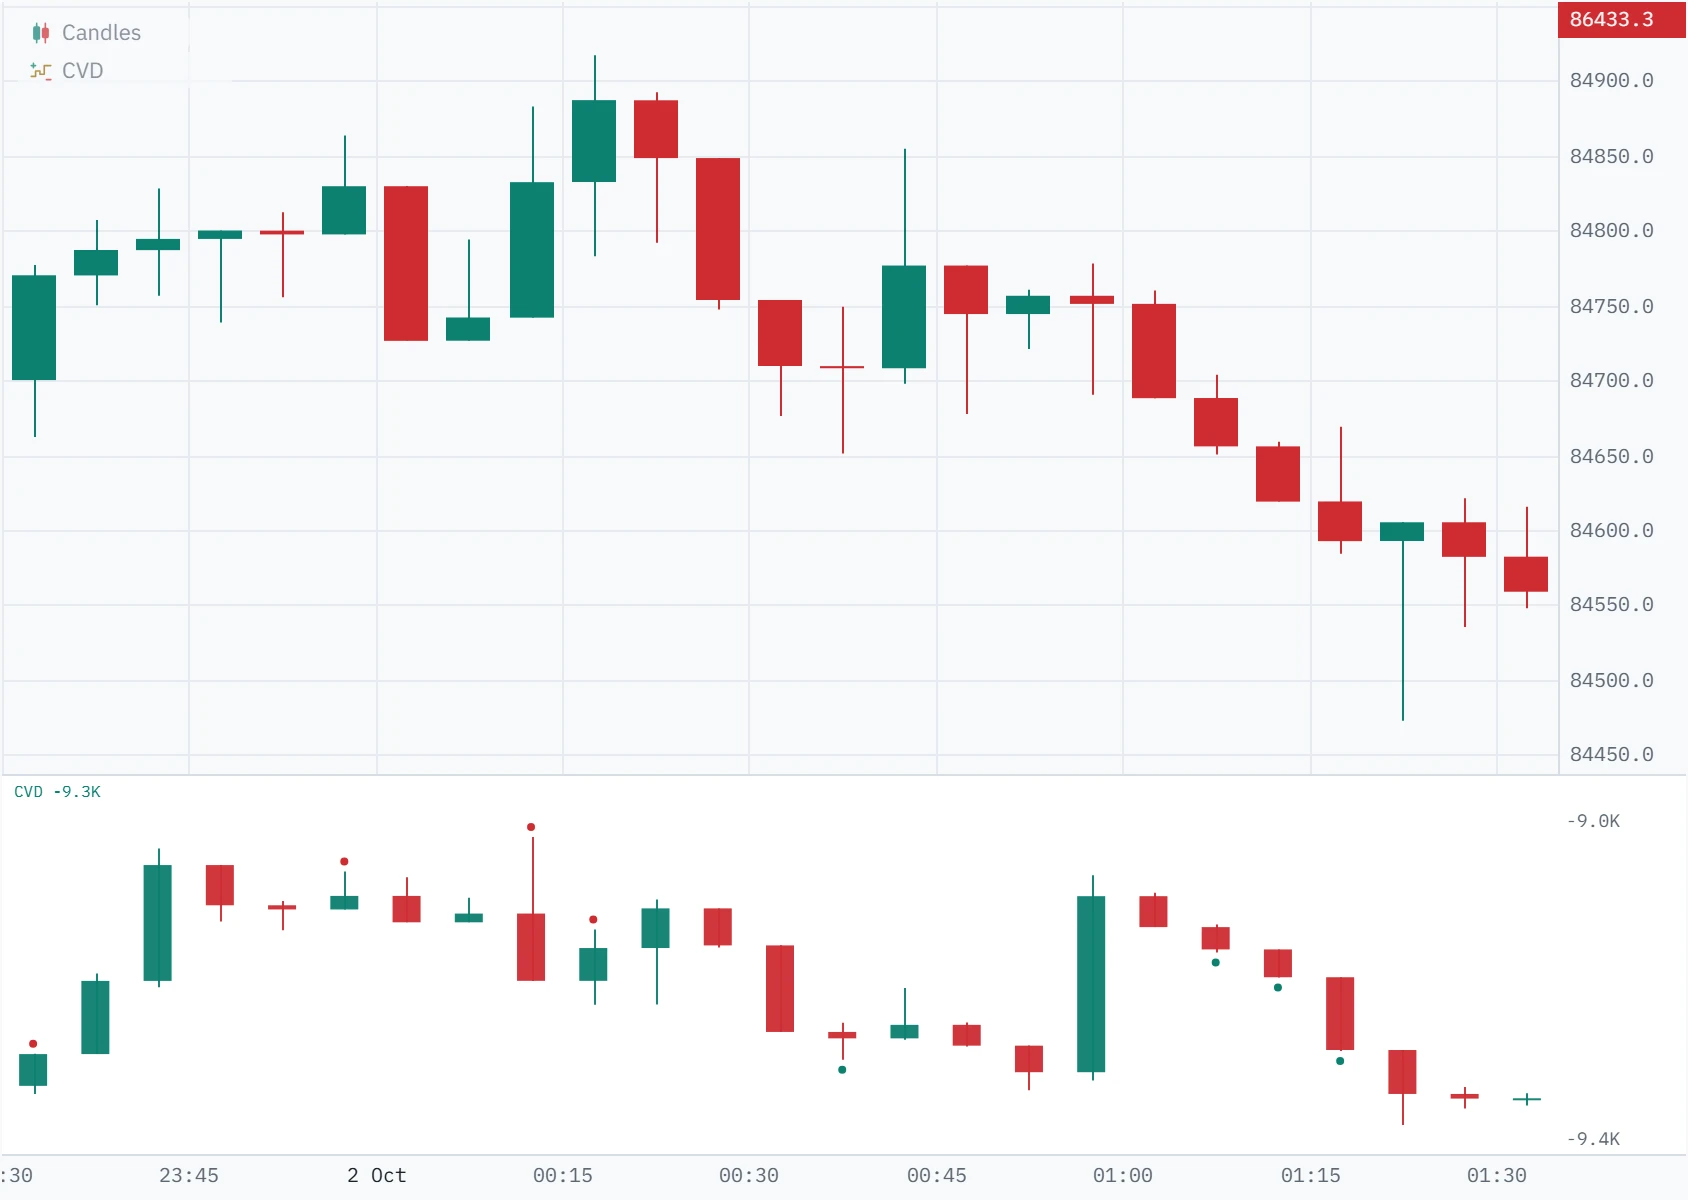
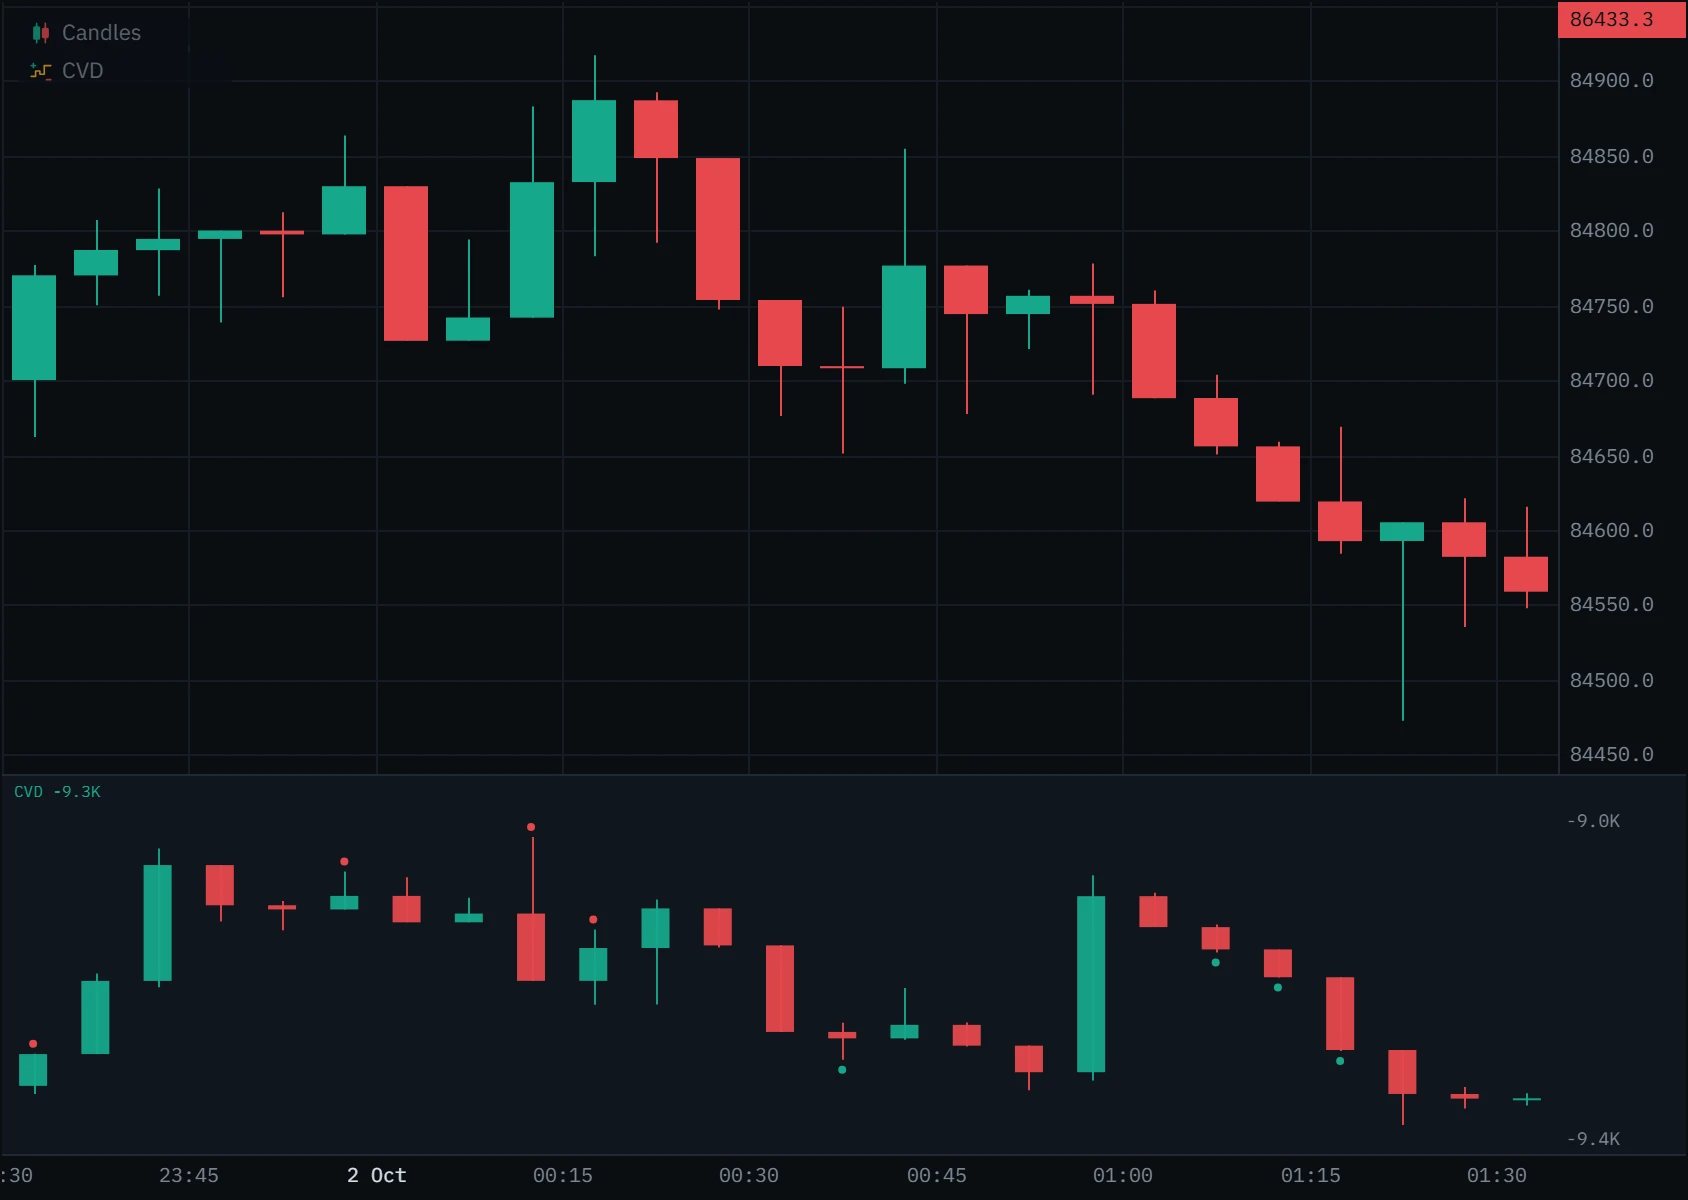
Real 5-minute bars on the Binance BTCUSDT perpetual over the night of 1 to 2 October 2026 (UTC). Each pair is the same 21 bars with and without the pane.
Set it up in Klustra
Open the chart
Go to the free chart and choose an exchange and instrument. No account is needed.
Add the pane
Open Indicators in the toolbar and pick CVD under Order flow. It docks under the price, below the delta panel if that is on.
Size and scale it
Drag the pane’s top edge to make it taller. Drag inside the pane to move its scale, drag the scale or use the wheel to stretch it, and double-click to hand it back to the automatic fit.
Choose the display
The gear beside CVD in the chart’s legend opens its settings: candles, line or histogram, the daily reset and the divergence lookback. The eye hides the pane without removing it.
Every setting
| Setting | Default | Range | What it changes |
|---|---|---|---|
| Display | Candles | Candles, Line or Histogram | How the pane draws: CVD candles with wicks, a line through each close, or each bar’s own delta as columns. |
| Reset each UTC day | Off | On or off | Restart at zero at 00:00 UTC, on timeframes under a day. Off, the count starts at the first bar loaded. |
| Divergence lookback (bars) | 14 | 0 to 100 | How many earlier bars a new high or low is measured against. Higher means fewer, larger divergences; 0 hides the dots. |
| Panel height (px) | 130 | 60 to 300 | How tall the pane is. Dragging its top edge changes it too. |
| Opacity | 0.95 | 0.2 to 1 | How strongly the candles, columns and wicks are drawn. |
Common mistakes and limits
- Reading the number. CVD’s level depends on where the count began. Compare its direction with price’s, or switch on the daily reset if you want a number that means the day.
- Trading every dot. A dot is a fact about the last few bars. At the default lookback on a one-minute chart there is one every few minutes.
- Reading it as buyers against sellers. Every trade has both. CVD counts the aggressive side, and an aggressive side can be absorbed and lose.
- Comparing exchanges. Klustra’s CVD is one exchange and one market at a time. Spot and perpetual are separate tapes, and so is each venue.
- Expecting wicks everywhere. Only bars built from trades have them. Exchange candles from before the order-flow window are bodies only, and on most exchanges they are not drawn at all.
Free and Pro
The CVD is part of the free chart, with the delta panel and the footprint. Pro reaches further back with order-flow history and adds the live book and tape tools.
| Feature | Free | Pro |
|---|---|---|
| CVD | Included | Included |
| Delta | Included | Included |
| Footprint chart (bid × ask) | Included | Included |
| Bid-ask imbalance and stacked imbalances | Included | Included |
| Order-flow history | Last 6 hours | Deep archive, where covered |
Questions
What is cumulative volume delta (CVD)?
The running total of delta: each bar’s market buying minus market selling, added to the total of every bar before it. Rising CVD means aggressive buyers have traded more than aggressive sellers since the count began; falling CVD means the reverse.
What is the difference between delta and CVD?
Delta is one bar. CVD is the sum of every bar so far, so it shows the run of buying and selling over time. The delta panel prints each bar’s delta; the CVD pane draws the running total.
What does a CVD divergence mean?
That price and aggression disagree. A higher high in price on a lower high in CVD says fewer aggressive buyers carried price there, or resting sellers absorbed them. It is a reason to look closer at that level, not a signal on its own.
Why does Klustra draw CVD as candles?
Because a line shows only where CVD closed each bar. A candle also shows how far it ran inside the bar: a long wick is a push that the other side took back before the close, which a line hides.
Why is my CVD a different number from another platform’s?
Mostly because the count starts somewhere else. Klustra counts from the first bar loaded, or from 00:00 UTC with the daily reset; other platforms start at their own session or at whatever history they loaded. Compare the shape, not the number.
Why is the CVD pane empty on Bybit and other exchanges?
Their candles report how much traded but not which side was aggressive, so CVD cannot be measured there. The pane starts where the chart has the exchange’s trades. Binance candles carry the split, so its history is drawn.
Does Klustra’s CVD combine several exchanges?
No. It is the CVD of the exchange and market on the chart: Binance spot and the Binance perpetual are two different numbers, and so is each venue.
Is the CVD indicator free?
Yes, with no account, on all seven exchanges Klustra connects to, spot and perpetual (Coinbase is spot only). Free order flow reaches back six hours.
Related tools
See it on a live market.
Open a supported market and switch the tool on. The footprint, delta, CVD and imbalances are free, with no account.
Order flow shows what traded, not what will trade next. Nothing on this page is financial advice, and trading carries a real risk of loss.